


Açıklama
FİKİR
Seviyelerini fiyata çeviren ve doğrudan grafikte gösteren bir RSI, momentum ve fiyatı ayrı bir pencere yerine aynı alanda tutar.
SORUN
RSI normalde ayrı bir pencerede okunur.
Kullanmak için, osilatör değerini ana grafikte fiyatın ne yaptığıyla sürekli karşılaştırmanız gerekir.
70, 30 veya 50 gibi seviyeler osilatördeki sayılardır. RSI'nın bu seviyelere ulaşması için fiyatın nerede olması gerektiğini söylemezler.
Bu yüzden gözle çeviri yapmaya devam edersiniz: "RSI 62'de — bu grafik üzerinde nerede?"
Sorun RSI'nın kendisi değildir.
Sorun momentum ve fiyatın iki farklı yerde, iki farklı birimde gösterilmesidir.
TEMEL KAVRAM: RSI SEVİYELERİ FİYAT SEVİYELERİNE DÖNÜŞÜR.
Geleneksel RSI sorar:
"Şu anda RSI değeri nedir?"
RSI Overlay sorar:
"RSI bu seviyeye hangi fiyatta ulaşır?"
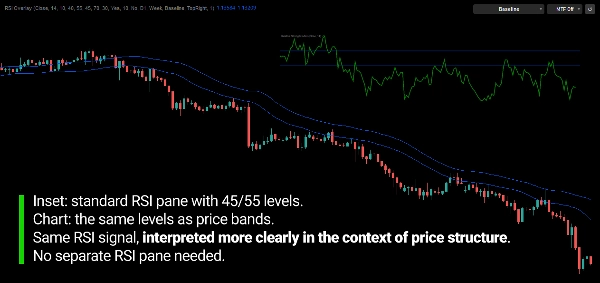
Her RSI seviyesi karşılık gelen fiyat seviyesine dönüştürülür ve doğrudan grafikte gösterilir.
Osilatör artık bir pencerede okuduğunuz ve başka bir pencereye çevirdiğiniz bir şey değildir.
Bilgisi, zaten analiz ettiğiniz hareketle aynı fiyat ölçeğinde ifade edilir.
RSI seviyesi belirler. Grafik bunu fiyat olarak gösterir.
NE YAPAR
RSI Overlay, seçilen RSI referanslarını dinamik fiyat seviyelerine dönüştürür ve bunları doğrudan ana grafikte gösterir.
Boğa ve Ayı Temel Çizgileri, Aşırı Alım ve Aşırı Satım seviyeleri ile iki RSI tabanlı referans, Yumuşatılmış RSI ve Ortalama RSI, tümü fiyat çizgileri olarak temsil edilir.
Çizgiler her yeni bar ile güncellenir, böylece sabit bir tarihsel fiyatta kalmak yerine en son RSI durumunu yansıtmaya devam ederler.
Bunlar geleneksel destek veya direnç seviyeleri değildir.
Mevcut RSI hesaplaması altında karşılık gelen RSI değerine ulaşılacak fiyatı temsil ederler.
Gösterge fiyatın nereye gideceğini tahmin etmeye çalışmaz.
Fiyatın gözlemlediğiniz RSI seviyelerine göre nerede olduğunu gösterir.
NASIL ÇALIŞIR
- RSI Wilder'ın yumuşatması kullanılarak hesaplanır.
- Her RSI seviyesi, onu üretecek fiyata dönüştürülür.
- Boğa ve Ayı Temel Çizgileri, merkez çizgisi etrafındaki momentum bölgesini işaretler (varsayılan 55 / 45).
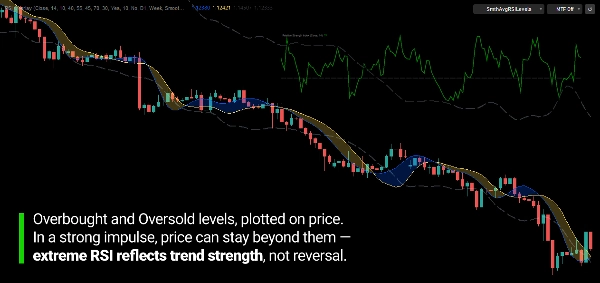
- Aşırı Alım ve Aşırı Satım seviyeleri aynı şekilde dönüştürülür (varsayılan 70 / 30).
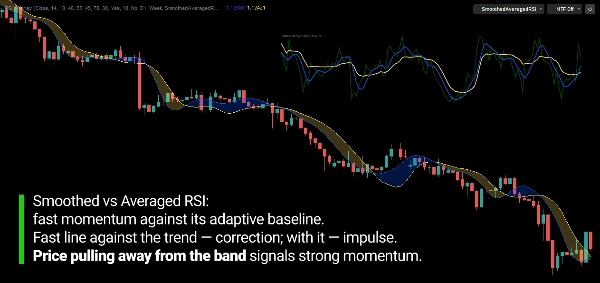
- Yumuşatılmış RSI ve Ortalama RSI da fiyat çizgilerine dönüştürülür.
RSI REFERANSLARI
Boğa / Ayı Temel Çizgileri
RSI'nın boğa veya ayı momentum bölgesine gireceği fiyat seviyeleri. Aralarındaki alan momentumun nötr olduğu yeri gösterir.
Yumuşatılmış RSI
RSI'nın gürültü azaltılmış versiyonu, daha yumuşak tepki veren bir fiyat çizgisi olarak gösterilir.
Ortalama RSI
RSI'nın daha yavaş, uyarlanabilir ortalaması, bir fiyat çizgisi olarak gösterilir. Daha istikrarlı bir momentum referansı sağlar.
Aşırı Alım / Aşırı Satım
RSI'nın aşırı alım ve aşırı satım eşiklerine ulaşacağı fiyat seviyeleri.
Bu referanslar otomatik sinyaller değildir.
Fiyat ve birbirlerine göre konumları, momentumun nasıl geliştiği hakkında bağlam sağlar.
ÇOKLU ZAMAN ÇERÇEVESİ BAĞLAMI
RSI, görüntülediğiniz grafik zaman çerçevesinden gelmek zorunda değildir.
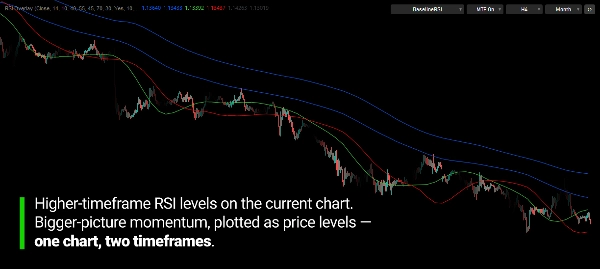
Örneğin, Haftalık veya Aylık RSI, H1 grafiğine yansıtılabilir.
Bu, daha yüksek zaman çerçevesi momentum çerçevesini doğrudan izlediğiniz fiyat hareketine yerleştirir.
Ne kadar geçmişin çizileceğini, son saatten birkaç yıla kadar siz seçersiniz.
Seçilen zaman çerçevesi, grafik zaman çerçevesinden daha yüksek olmalıdır.
GRAFİKTEN KONTROL EDİN
On bir görüntüleme modu, sadece ihtiyacınız olanı göstermenizi sağlar; temiz bir çift temel çizgiden tam RSI referans setine kadar.
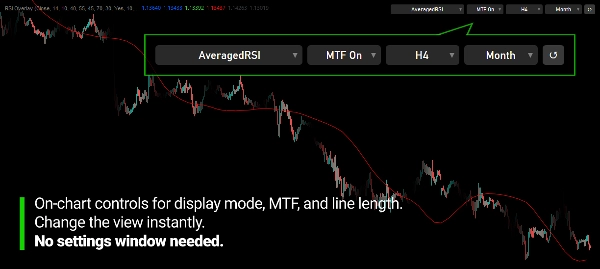
Grafikteki kompakt kontrol çubuğu, görüntüleme modunu değiştirmeye, çoklu zaman çerçevesini açıp kapatmaya ve ayarları yeniden açmadan zaman çerçevesi ve uzunluğu değiştirmeye olanak tanır.
Sıfırlama düğmesi her şeyi başlangıç parametrelerinize geri döndürür.
Çubuk herhangi bir köşeye yerleştirilebilir veya gizlenebilir.
GÖZLEMLEYEBİLECEKLERİNİZ
Gösterge birkaç şeyi görünür kılmak için tasarlanmıştır:
- Fiyatın boğa ve ayı momentum bölgelerine göre nerede olduğu
- Fiyatın aşırı alım ve aşırı satım seviyelerinden fiyat bazında ne kadar uzak olduğu
- Temel çizgiler etrafındaki momentum değişimleri
- Yumuşatılmış ve ortalama RSI'ya göre geri çekilmeler ve devamlar
- Daha düşük zaman çerçevesi grafikte daha yüksek zaman çerçevesi momentum bağlamı
RSI Overlay bir ölçüm aracıdır, bağımsız bir al/sat sistemi değildir.
FİYAT BAZINDA MOMENTUM İÇİN TASARLANDI
Amaç RSI'nın yerini almak değildir.
Osilatörü gözle fiyat olarak çevirmeye gerek kalmadan kullanmaktır.
RSI hakkında bildiğiniz her şey geçerlidir. Sadece kararların gerçekten verildiği yerde gösterilir: fiyat grafiğinde.
ANA ÖZELLİKLER
- Ana grafikte fiyat seviyelerine dönüştürülmüş RSI seviyeleri
- Boğa ve Ayı Temel Çizgileri (varsayılan 55 / 45)
- Aşırı Alım ve Aşırı Satım fiyat seviyeleri (varsayılan 70 / 30)
- Yumuşatılmış RSI çizgisi
- Ortalama RSI çizgisi
- Daha düşük zaman çerçevesi grafiklerinde çoklu zaman çerçevesi RSI
- Çoklu zaman çerçevesi çizgileri için seçilebilir görüntüleme uzunluğu
- 11 görüntüleme modu
- Sıfırlama özellikli grafikte kontrol çubuğu
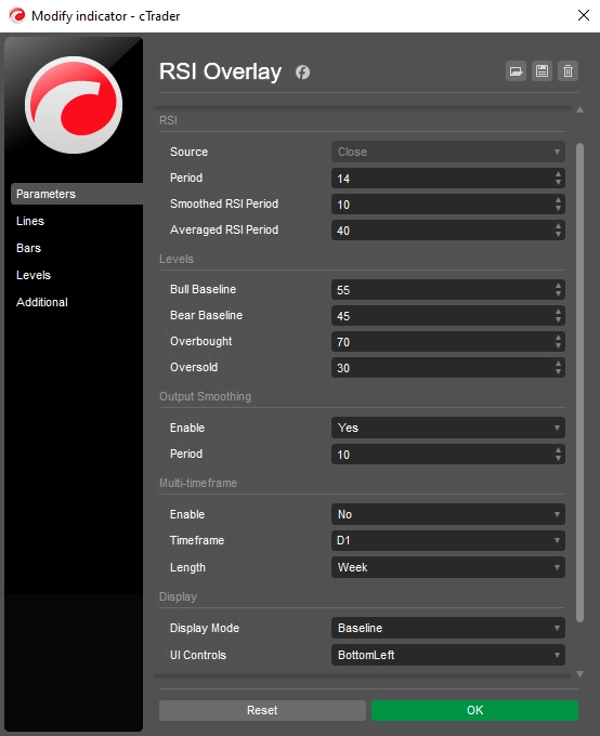
- Yapılandırılabilir kaynak, RSI periyodu, yumuşatma ve ortalama
- Özelleştirilebilir renkler, çizgi stilleri ve kalınlık
---
Ticaret risk içerir. Bu gösterge teknik analiz aracıdır ve uygun risk yönetimi ile birlikte kullanılmalıdır.
Özet
It supports multi-timeframe analysis by allowing RSI data from higher timeframes (e.g., weekly or monthly) to be displayed on lower timeframe charts, providing broader momentum context. Users can customize display modes, line styles, colors, and control parameters directly from an on-chart control bar, which includes options to reset settings and adjust timeframe and length without reopening menus.
RSI Overlay serves as a measurement tool to visualize where price stands relative to momentum zones and RSI thresholds in price terms. It does not generate automatic trading signals but aids in observing momentum shifts, pullbacks, and continuations aligned with RSI levels on the price chart.
Müşteri değerlendirmeleri
5 | 100 % | |
4 | 0 % | |
3 | 0 % | |
2 | 0 % | |
1 | 0 % |
Tartışma
SSS






!["[Stellar Strategies] MARSI Signal Plotter" logosu](https://cdn.ctrader.com/image/webp/7b2b8da6-8f8e-4646-8d4a-4710c516c01e_25567)
















Fiyat