Описание
Обзор
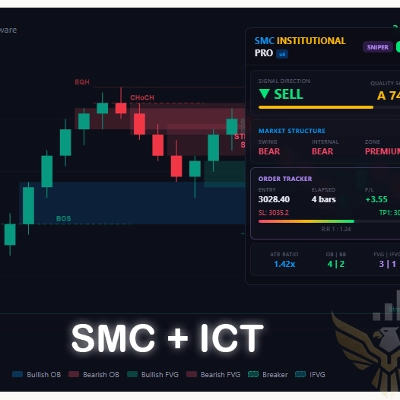
Этот профессиональный индикатор на основе ИКТ создан для трейдеров, применяющих институциональные концепции, такие как NWOG (New Week Opening Gap — разрыв открытия новой недели), NDOG (New Day Opening Gap — разрыв открытия нового дня) и EHPDA (Equilibrium High Probability Dealing Arrays — массивы сделок с высокой вероятностью равновесия). Он обеспечивает чистую и точную визуализацию ключевых ценовых неэффективностей и зон равновесия.
Основные особенности
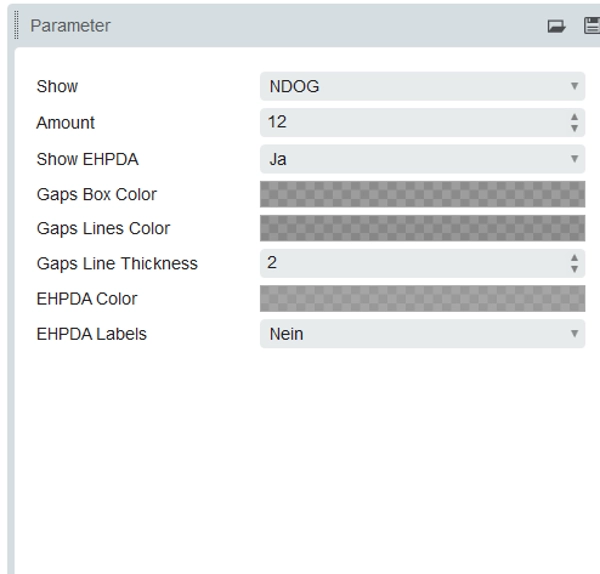
- Обнаружение NWOG: Автоматически отмечает разрывы открытия новой недели, выделяя области, где цена, вероятно, будет ребалансироваться.
- Обнаружение NDOG: Определяет разрывы открытия нового дня для внутридневных торговых возможностей.
- Зоны EHPDA: Отображает премиальные и дисконтные зоны внутри диапазонов сделок для оптимального позиционирования в торговле.
Как это работает
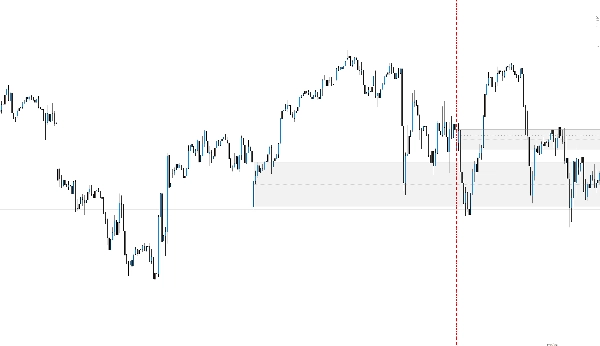
Индикатор отслеживает движение цены и выявляет разрывы, созданные в начале каждой торговой сессии. Эти разрывы часто действуют как магнит для цены. Комбинируя NWOG и NDOG с логикой EHPDA, трейдеры могут предвидеть, где цена, вероятно, отреагирует, развернется или продолжит движение.
Преимущества торговли
- Повышает точность и своевременность входа
- Помогает выявлять высоковероятные торговые установки
- Согласует сделки с институциональным потоком ордеров
- Подходит как для внутридневной, так и для свинг-торговли
Для кого это
Идеально подходит для трейдеров, использующих ИКТ и концепции Smart Money, которые хотят структурированный, основанный на правилах подход к анализу рыночных неэффективностей и ликвидности.
Сводка
Отзывы покупателей
5 | 50 % | |
4 | 50 % | |
3 | 0 % | |
2 | 0 % | |
1 | 0 % |