الوصف
تجيب معظم مؤشرات الاتجاه على نفس السؤال بنفس الطريقة: تنعيم السعر، رسم بعض الخطوط، البحث عن تقاطعات. تم بناء قناة السعر FDQ حول سؤال مختلف — ما الذي يفعله السعر فعليًا، خالية من الضوضاء والانجراف، وماذا يخبرك ذلك عن المكان الذي من المحتمل أن يذهب إليه؟
النتيجة هي مؤشر اتجاه قائم على القناة يجمع بين ثلاث طبقات تحليلية مميزة في طبقة واحدة قابلة للقراءة.
- النقاط الرئيسية
نقطة انطلاق مختلفة. سلسلة الأسعار التي يستخدمها معظم المؤشرات هي، إحصائيًا، مشكلة.
تحمل الأسعار الخام مكونًا من السير العشوائي الذي يحجب الهيكل المعنوي. قبل رسم أي قناة، يطبق FDQ تحويل التفريق الكسري — وهي تقنية مستعارة من البحث الكمي — التي تزيل هذا الانجراف مع الحفاظ عمدًا على الذاكرة طويلة المدى في البيانات. ما يتبقى هو سلسلة محولة تعكس مكان السوق الذي كان فيه، لكنها لم تعد تهيمن عليها الحالة الحالية. هذا هو الأساس الذي يُبنى عليه كل شيء آخر.
- للضوضاء تكلفة
كل طريقة تنعيم تعتمد على التأخير تتبادل التوقيت مقابل الدقة. فلترة كالمان لا تفعل ذلك.
فلتر كالمان هو عملية تقدير تكرارية: يقوم بتحديث رؤيته للسوق باستمرار، موازنًا بين مدى الثقة في البيانات الجديدة مقابل ما تم تأسيسه بالفعل. على عكس المتوسط المتحرك، ليس لديه نافذة نظر ثابتة ولا يعامل كل الأشرطة السابقة على قدم المساواة. الناتج هو تمثيل أنظف للسعر يستجيب بسرعة للحركات الحقيقية ويقاوم التفاعل مع الضوضاء — دون الإشارات المتأخرة التي ينتجها التنعيم عادة.
- أشرطة مبنية على السلوك، لا على الصيغة
تفترض أشرطة الانحراف المعياري أن السعر موزع طبيعيًا. وهذا نادر الحدوث.
يتم تعريف حدود قناة FDQ باستخدام تحليل الكوانتايل — التوزيع الإحصائي الفعلي للسعر المحول خلال فترة النظر للخلف. تحدد الشريط العلوي المستوى الذي تصل إليه السلسلة فعليًا عند أقصى حد علوي لنطاقها؛ والشريط السفلي يفعل الشيء نفسه عند الحد الأدنى. هذه ليست حدودًا نظرية محسوبة من المتوسط — بل تعكس مكان تداول السعر فعليًا، مما يجعلها أكثر استجابة لكيفية تصرف السوق حقًا في أي وقت معين.
- طبقة ثانية داخل القناة
الأشرطة الخارجية تحدد النطاق. الأشرطة الداخلية تحدد المنطقة.
مجموعة ثانية من الأشرطة تقع بشكل نسبي بين القناة الخارجية وخط المنتصف الخاص بها. تخلق هذه الطبقة الداخلية منطقة تداول مميزة — أضيق من القناة الكاملة، ومثبتة على نفس الأساس الإحصائي — والتي تعمل كمرجع متدرج للدخول وتصنيف الإشارات.
- حالة الاتجاه قبل كل شيء آخر
الإشارة بدون سياق هي مجرد بيانات عشوائية.
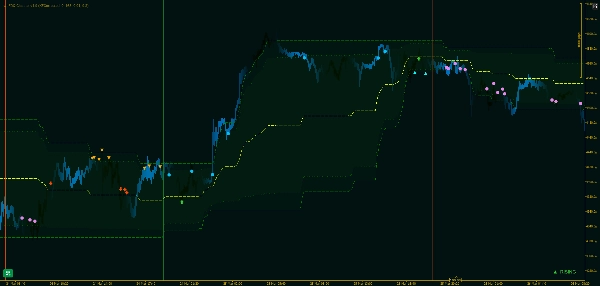
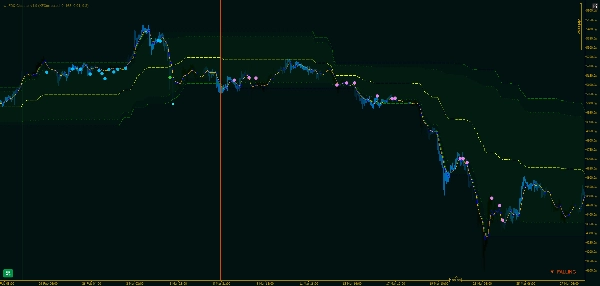
يتتبع المؤشر حالة الاتجاه للقناة باستمرار، باستخدام آلية تصويت بالأغلبية عبر مكونات الأشرطة الثلاثة. عندما يتحرك اثنان على الأقل من الثلاثة في نفس الاتجاه، يتم تأكيد حالة الاتجاه على أنها صاعدة أو هابطة. يتم توليد الإشارات فقط بالتوافق مع الحالة الحالية — إعدادات الشراء فقط في ظروف الصعود، وإعدادات البيع فقط في ظروف الهبوط. عندما لا يفي السوق بهذا الحد، لا يتم إعلان حالة ولا يتم توليد إشارات. يتم تمييز الانتقالات بين الحالات بخطوط عمودية مباشرة على الرسم البياني.
- ثلاث إعدادات ارتداد مميزة
ليست كل التراجعات متساوية. يتعرف المؤشر على ثلاث درجات.
بمجرد تفعيل حالة الاتجاه، يراقب المؤشر أنماط ارتداد محددة — لحظات يتحرك فيها السعر عكس الاتجاه، يلمس مستوى محدد، وينعكس مرة أخرى عبره.
-
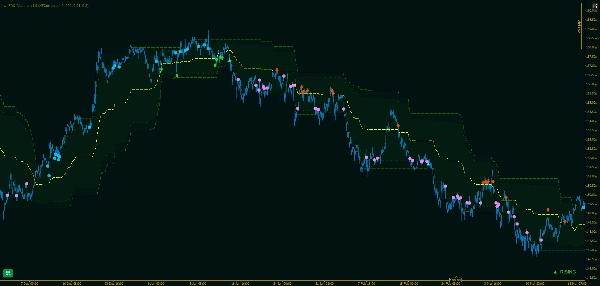
- ارتداد متوسط — ينخفض السعر تحت (أو يرتفع فوق) خط منتصف القناة ويتعافى. تراجع قياسي ضمن الاتجاه.
- ارتداد عميق— يمتد السعر أكثر، ليصل إلى الحد الداخلي قبل التعافي. تراجع أكثر التزامًا مع انعكاس أكثر حسمًا.
- ارتداد خفيف— يلمس السعر الشريط الداخلي على جانب الاتجاه ويرتد بسرعة. هو الأضحل من الثلاثة، ويحدث بشكل متكرر أكثر.
كل نوع مميز بصريًا على الرسم البياني ويمكن تمكينه أو تعطيله بشكل مستقل.
- ما تراه
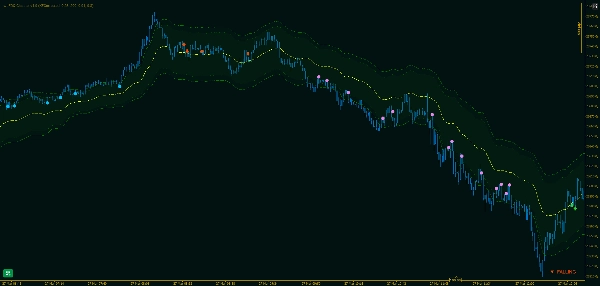
الرسم البياني يروي القصة مباشرة، بدون تفسير.
القناة الأساسية، الأشرطة الداخلية، وخط المنتصف تراكب السعر كخطوط مستمرة. يتم تمييز انتقالات النظام بخطوط عمودية — خضراء للصعود، وحمراء للهبوط — بحيث يكون تاريخ تغييرات حالة الاتجاه مرئيًا بنظرة واحدة. تظهر علامات الإشارة عند الشمعة التي يتم فيها تأكيد كل ارتداد، مع أيقونات منفصلة لكل نوع إشارة واتجاه.
- لماذا هذا النهج متين
معظم مؤشرات القناة تتأخر عندما تتحرك الأسواق بسرعة وتفرط في التفاعل عندما لا تتحرك.
لأن قناة FDQ مبنية على تحويل ثابت يحافظ على الذاكرة بدلاً من المتوسط المتحرك المتداول، فإن الأشرطة تتكيف مع توزيع السلوك الفعلي بدلاً من ملاحقة السعر. تحافظ طبقة كالمان على التقدير الأساسي نظيفًا دون إدخال تكلفة التوقيت التي تأتي مع التنعيم النافذ. النتيجة هي قناة تظل ذات معنى عبر ظروف السوق المختلفة — الاتجاهية، المتراوحة، والانتقالية — دون الحاجة إلى تعديل يدوي.
الملخص
The channel boundaries are defined by quantile analysis of the transformed price distribution rather than standard deviation, capturing actual price extremes over the lookback period. It features outer bands marking the full range and inner bands creating a narrower trading zone for refined entry signals. The indicator continuously tracks trend direction using a majority vote across three band components, confirming Rising or Falling states and marking transitions with vertical lines on the chart.
Within active trends, wt.FDQ Channel identifies three distinct rebound setups—Light, Mid, and Deep—each representing different pullback intensities and reversal confirmations. These signals are visually distinct and configurable. The overlay displays the primary channel, inner bands, midline, trend states, and rebound signals directly on the price chart, supporting analysis across various markets including Forex, indices, and cryptocurrencies.
تقييمات العملاء
5 | 100 % | |
4 | 0 % | |
3 | 0 % | |
2 | 0 % | |
1 | 0 % |


