Mô tả
━━━━━━━━━━━━━━━━━━━━━━━━━━━━━━━━━━━━━━━━
ATR Risk Visualizer — Rủi ro
━━━━━━━━━━━━━━━━━━━━━━━━━━━━━━━━━━━━━━━━
Hiển thị ngay lập tức các mức Stop Loss và Take Profit dựa trên ATR — với bản đồ R-multiple đầy đủ (1R đến 5R) và nhãn pip — để bạn luôn giao dịch với rủi ro được xác định trước khi vào lệnh.
─────────────────────────────
TÍNH NĂNG CHÍNH
► Stop Loss dựa trên ATR — khoảng cách SL được tính bằng ATR × hệ số có thể cấu hình (mặc định 1.5×)
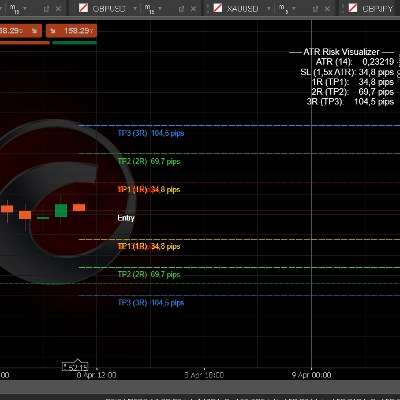
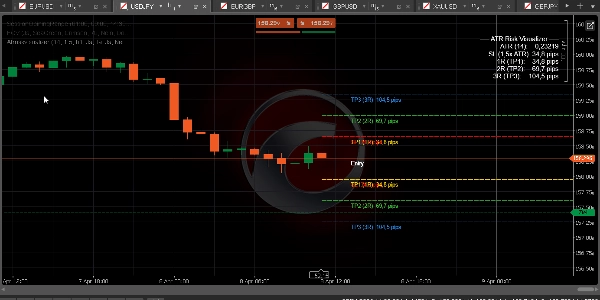
► Take Profit R-Multiple — TP1 (1R), TP2 (2R), TP3 (3R), TP4 (4R), TP5 (5R) được vẽ tự động từ giá hiện tại
► Nhãn pip trên mỗi mức — xem khoảng cách pip chính xác cho SL và từng TP ngay lập tức
► Mức Long và Short cùng lúc — hoặc chuyển sang chế độ chỉ Long hoặc chỉ Short
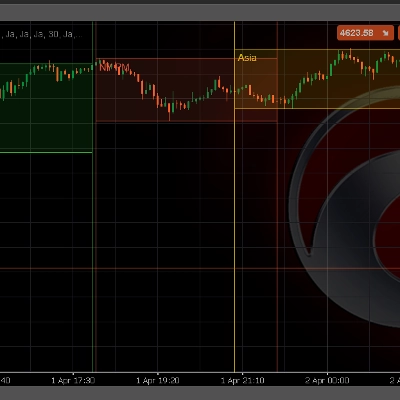
► Bộ chọn khung thời gian ATR — tính ATR từ khung thời gian cao hơn (ví dụ ATR H1 trên biểu đồ M15)
► Bảng thông tin ATR (góc trên bên phải) — hiển thị giá trị ATR, kích thước SL và TP1/2/3 tính bằng pip
► Kiểm soát màu sắc đầy đủ — màu riêng biệt cho SL, TP1, TP2, TP3, TP4/5 qua bộ chọn màu gốc của cTrader
► Kiểu đường có thể cấu hình (Đặc / Gạch / Chấm) và độ dày
► Giá Ask hoặc Bid làm tham chiếu vào lệnh — chọn theo hướng giao dịch của bạn
─────────────────────────────
CÀI ĐẶT MẶC ĐỊNH
→ Chu kỳ ATR 14
→ Hệ số ATR 1.5× (SL = 1.5 × ATR)
→ Khung thời gian ATR H1
→ Hiển thị TP1/2/3 BẬT
→ Hiển thị TP4/5 TẮT
→ Hướng Cả hai (Long + Short)
→ Màu SL Đỏ
→ Màu TP1 Vàng
→ Màu TP2 Xanh lục
→ Màu TP3 Xanh dương
→ Kiểu đường Gạch
─────────────────────────────
CÁCH SỬ DỤNG
1. Thêm chỉ báo vào bất kỳ biểu đồ nào
2. Đặt Chu kỳ ATR và Hệ số phù hợp với chiến lược của bạn (1.5× ATR là tiêu chuẩn cho Forex/Vàng)
3. Đặt Khung thời gian ATR thành H1 hoặc H4 để kích thước SL mượt mà hơn
4. Đọc giá trị pip trực tiếp từ nhãn trên biểu đồ
5. Sử dụng TP1 (1R) để thoát một phần đầu tiên, TP2 (2R) để hòa vốn, TP3 (3R) để đạt mục tiêu đầy đủ
6. Kết hợp với các chỉ báo BOS/CHoCH và FVG để có quy trình vào lệnh SMC hoàn chỉnh
─────────────────────────────
PHÙ HỢP CHO
✔ Các nhà giao dịch FTMO và công ty prop phải định kích thước rủi ro chính xác
✔ Các nhà giao dịch SMC và ICT sử dụng R-multiples để quản lý giao dịch
✔ Các nhà giao dịch Forex, Vàng và Chỉ số trên mọi khung thời gian
✔ Các nhà giao dịch muốn bản đồ rủi ro trực quan rõ ràng trước mỗi lần vào lệnh
✔ Bất kỳ ai xây dựng phương pháp hệ thống để định kích thước vị thế
─────────────────────────────
TƯƠNG THÍCH
→ Nền tảng cTrader (Máy tính để bàn & Web)
→ Các loại tài sản Forex, Chỉ số, Hàng hóa, CFD tiền điện tử
→ Khung thời gian Tất cả (M1 đến MN)
→ Quyền truy cập Không yêu cầu
→ Loại tài khoản Thực & Demo
━━━━━━━━━━━━━━━━━━━━━━━━━━━━━━━━━━━━━━━━
Tóm tắt
Đánh giá của khách hàng
5 | 50 % | |
4 | 50 % | |
3 | 0 % | |
2 | 0 % | |
1 | 0 % |