Opis
G.A.S - Smart Entry Zone to wskaźnik price action dla US500 (S&P 500 CFD), który pomaga
traderom identyfikować punkty wejścia o wysokim prawdopodobieństwie wokół ręcznie zdefiniowanej strefy cenowej.
--- CO ANALIZUJE ---
Wskaźnik monitoruje zachowanie ceny wokół dwóch poziomów poziomych zdefiniowanych przez użytkownika -
górnej i dolnej granicy Smart Entry Zone. Śledzi, jak cena zbliża się,
przebija i reaguje na te poziomy na podstawie każdej świecy, szukając konkretnych
wzorów potwierdzenia przed wygenerowaniem sygnału.
--- JAK INTERPRETOWAĆ SYGNAŁY I ELEMENTY WIZUALNE ---
Linie strefy oznaczają górne i dolne granice strefy wejścia dla wybranego
dnia handlowego. Wykrywane są trzy typy sygnałów:
- Przypadek A - Cena przebija strefę knotem, a następnie zamyka się ponownie na zewnątrz niej. Kolejna
świeca zamykająca się w kierunku wybicia wyzwala sygnał. Jeden sygnał
na zdarzenie przebicia (jednorazowy).
- Przypadek B - Poprzednia świeca zamknęła się na zewnątrz strefy, obecna świeca przebija ją knotem i
zamyka się ponownie na zewnątrz. Potwierdza to retest granicy strefy.
- Przypadek C - Dokładnie w momencie otwarcia okna czasowego sygnału cena jest już
poza strefą. Pierwsza potwierdzająca świeca w tym kierunku wyzwala sygnał.
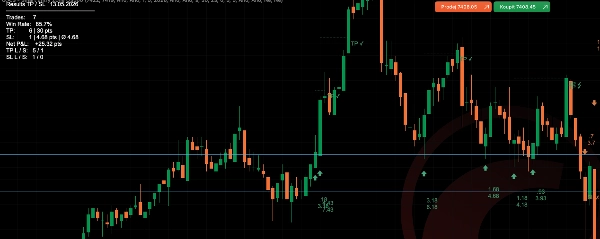
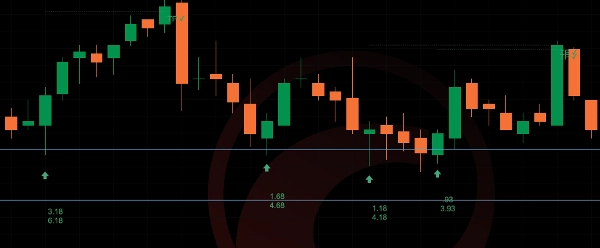
Sygnały są wyświetlane jako strzałki poniżej (bycze) lub powyżej (niedźwiedzie) świecy sygnałowej.
Gdy wyświetlanie TP/SL jest włączone, przerywane linie pokazują poziomy take profit i stop loss
od świecy wejścia. Etykieta TP lub SL oznacza wynik, gdy poziom zostanie osiągnięty.
Opcjonalna etykieta SL Distance pokazuje w czasie rzeczywistym, jak daleko aktualna cena jest od
granicy strefy stop loss.
--- KLUCZOWE USTAWIENIA I PARAMETRY ---
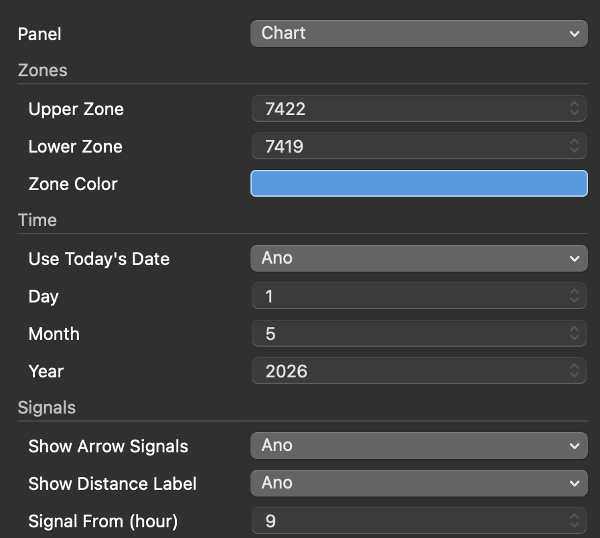
- Strefy: górny i dolny poziom cenowy, kolor linii, pokaż/ukryj
- Data: automatyczne użycie dzisiejszej daty lub ręczne ustawienie konkretnej daty
- Sygnały: włącz strzałki, skonfiguruj okno czasowe (np. 15:30 / 23:00), okres ważności przebicia
(ile świec po przebiciu sygnał pozostaje ważny), etykiety odległości włącz/wyłącz
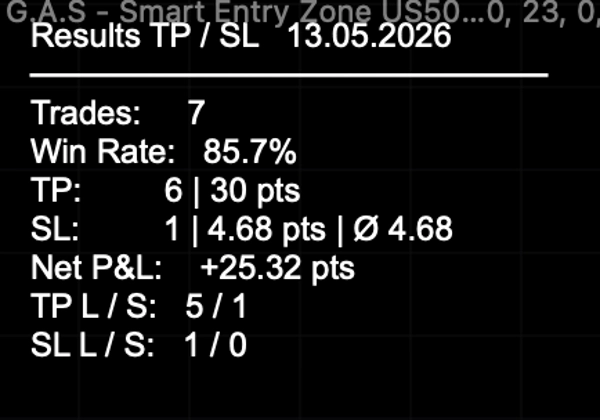
- TP/SL: take profit w punktach, pokaż linie i etykiety, tabela wyników włącz/wyłącz,
tryb pojedynczego zlecenia (jedno otwarte zlecenie na raz), niestandardowe kolory
- SL Distance: włącz etykietę, niestandardowy kolor
--- TYPOWE PRZYPADKI UŻYCIA I SCENARIUSZE HANDLOWE ---
Wskaźnik jest przeznaczony do handlu intraday na US500 na wykresie 5-minutowym. Typowy
przebieg pracy to: przed otwarciem rynku amerykańskiego trader ustawia górne i dolne poziomy strefy
na dany dzień. Gdy okno sygnału się otwiera (domyślnie 15:30 Praga / 09:30 Nowy Jork),
wskaźnik monitoruje ustawienia Przypadku A, B lub C i oznacza ważne wejścia strzałkami.
Tracker TP/SL automatycznie rejestruje wyniki w trakcie sesji.
--- DLA KOGO TEN WSKAŹNIK JEST NAJLEPSZY ---
Dla traderów średniozaawansowanych i zaawansowanych, którzy mają już zdefiniowaną metodologię intraday i
używają stałych stref cenowych jako części procesu decyzyjnego. Wskaźnik nie
generuje stref automatycznie - trader musi codziennie ręcznie zidentyfikować i wprowadzić poziomy.
Nie jest odpowiedni dla początkujących szukających w pełni automatycznego systemu sygnałów.
--- WAŻNE OGRANICZENIA I UWAGI DOTYCZĄCE UŻYTKOWANIA ---
- Poziomy strefy muszą być wprowadzane ręcznie każdego dnia handlowego - wskaźnik nie
oblicza ich automatycznie.
- Zaprojektowany i przetestowany dla US500 na wykresie 5-minutowym. Zachowanie na innych instrumentach
lub ramach czasowych nie jest gwarantowane.
- Statystyki sygnałów z przeszłości pokazane w tabeli wyników są wyłącznie do celów informacyjnych i nie
stanowią gwarancji przyszłych wyników.
- Okno czasowe sygnału używa wewnętrznie czasu praskiego (CET/CEST). Dostosuj
ustawienia godzin od/do, jeśli twój broker używa innego czasu serwera.
Podsumowanie
Signals appear as arrows indicating bullish or bearish entries, with optional automatic tracking and display of take profit (TP) and stop loss (SL) levels, including real-time SL distance labels. Users can customize zone levels, signal time windows, TP/SL parameters, and visual elements. The indicator logs trade statistics throughout the session for performance reference.
Intended for intermediate to advanced traders who incorporate fixed price zones into their intraday strategies, it requires manual input of zone levels daily and is specifically tailored for the US500 instrument. The indicator does not generate zones automatically and is not designed for other instruments or timeframes. Time settings use Prague time internally and should be adjusted if needed.


