Açıklama
🚀 10.000+ tüccar zaten en iyi göstergelerimizi🏆 kullanıyor
Profesyonellerin neden bizi seçtiğini keşfedin – en güçlü araçlar cTrader’da (göstergeler, algoritmalar ve cBotlar) sizi bekliyor.
👉 Tüm en iyi sistemlerimizi buradan edinin:
_______________________________________________
📌 Piyasa Yapısı Göstergeleri
· ✅ AdvancedMarket Structure: Bos, Choch, SwinLevels, Order Blocks, Market Structure& Likidite Bulucu
· 🔄 Dinamik Piyasa Yapısı Dönüş Noktalarının Analizi
· 🧱 Order Block
· ⚖️ Piyasa Dengesizliği
· ⛓️ BOS & CHOCH
· 🧠 ICT Güç 3
_______________________________________________
🔚 Akıllı Çıkış Sistemleri
· 📍 Takip Eden Akıllı Algoritma
_______________________________________________
📐 ZigZag Göstergeleri
· 🔍 ZigZag Fiyat Likidite Projeksiyonu
· ➖ ZigZag
· 🎯 Zig-Zag Uç Nokta Takipçisi
_______________________________________________
🧱 Destek & Direnç Göstergeleri
· 🟩 SmartTrend Destek & Direnç Çizgileri
· 🧱 Tüm Destek ve Direnç Seviyeleri
_______________________________________________
📊 Trend & Kanal Göstergeleri
· 📊 Süpertrend
· 🧠 Uyarlanabilir Trend Kanalı
· 🔁 Reaktif Hareketli Ortalama
_______________________________________________
💧 Hacim & Likidite Araçları
· 🔍 Momentum Adil Değer Boşluğu
· 🕒 Adil Değer Boşluğu Seansları
_______________________________________________
⚡ Momentum & RSI Göstergeleri
· 🔎 Çok Katmanlı Mum Eğilimi
Takipçisi
_______________________________________________
🔮 Tahmin & Projeksiyon Araçları
· 📐 Linreg & ATR’ye Dayalı Tahmin
· 📏 Fibonacci Doğrusal Regresyon Çok Zamanlı Çerçeve
· 📈 Hacim Destekli Piyasa Akışı Projeksiyonu
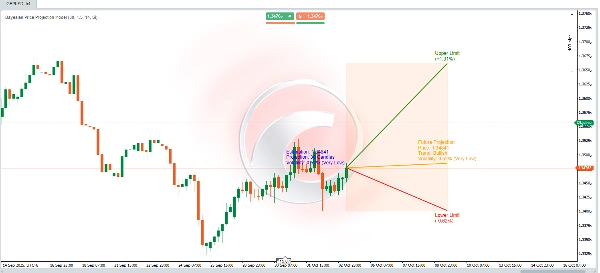
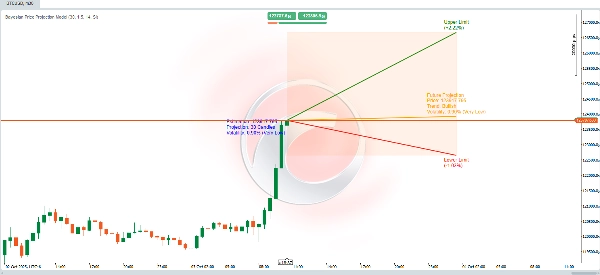
📊 Dinamik Fiyat Projeksiyon Algoritması 📈
Bu algoritma, gelecekteki fiyatı tahmin etmek için **istatistiksel hesaplamaları**, **teknik analizi** ve **Bayesçi teoriyi** birleştirir ve üst ve alt sınırları temsil eden **belirsizlik aralıkları** sağlar. Hesaplamalar, piyasa **trendleri**, **volatilite** ve yeni zirvelere veya dip seviyelere ulaşma tarihsel olasılıklarını dikkate alarak projeksiyonları ayarlamak üzere tasarlanmıştır.
İşte nasıl çalışır:
🚀 Gelecek Fiyat Projeksiyonu
Dinamik bir hesaplama, üç ana unsur temelinde gelecekteki fiyatı tahmin eder:
1. **Trend**: Piyasanın yukarı mı yoksa aşağı mı hareket etmeye eğilimli olduğunu tanımlar.
2. **Volatilite**: Tarihsel dalgalanmalara dayanarak beklenen değişimin büyüklüğünü niceler.
🧠 **Bayesçi Olasılıksal Ayarlama**
- Koşullu olasılıklar **Bayes formülü** kullanılarak hesaplanır:
\[
P(A|B) = \frac{P(B|A) \cdot P(A)}{P(B)}
\]
Bu, koşullu bilgiler kullanarak gelecekteki olayları modeller:
- Fiyat yukarı yönlü trenddeyse **yeni tüm zamanların en yüksek seviyesine ulaşma olasılığı**.
- Fiyat aşağı yönlü trenddeyse **yeni tüm zamanların en düşük seviyesine ulaşma olasılığı**.
- Bu olasılıklar, gelecekteki fiyat tahminini şu şekilde iyileştirir:
- **Daha yüksek volatilite**, aşırı seviyelere (zirveler/dipler) ulaşma olasılığını artırır.
- **Piyasa trendleri**, beklenen fiyat hareketi yönünü etkiler.
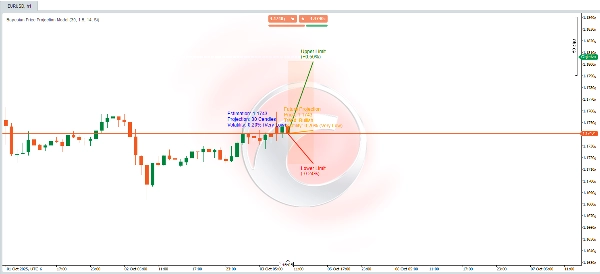
🌟 **Volatilite Hesaplaması**
- Volatilite, 14 periyotluk pencere ile **ATR (Ortalama Gerçek Aralık)** göstergesi kullanılarak ölçülür. Bu, fiyat dalgalanmalarının ortalama genliğini yansıtır.
- Volatiliteyi yüzde olarak ifade etmek için ATR, kapanış fiyatına bölünür ve 200 ile çarpılır.
- Volatilite, daha iyi yorumlama için açıklayıcı seviyelere (örneğin, **Çok Düşük**, **Düşük**, **Orta**, vb.) kategorize edilir.
---
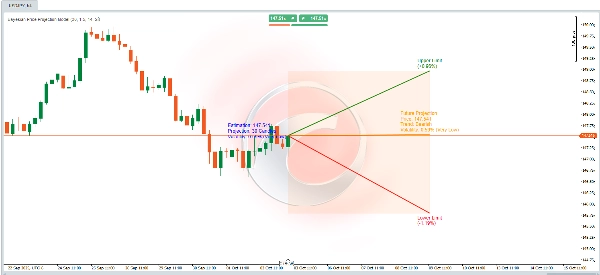
🎯 **Sapma Limitleri (Üst ve Alt)**
- Üst ve alt limitler, tahmin edilen gelecekteki fiyat etrafında bir **projeksiyon aralığı** oluşturur ve belirsizlik için bir çerçeve sağlar.
- Bu limitler, ATR’nin şu şekilde ayarlanmasıyla hesaplanır:
- Kullanıcı tarafından tanımlanan **çarpan** (`factor_desviacion`).
- Önceden hesaplanan **Bayesçi olasılıklar**.
- Belirsizliğin zamanla arttığı prensibini içeren **projeksiyon dönemi karekökü** (`proyeccion_dias`).
🔍 **Modelin Yorumlanması**
Bu, şu özelliklere sahip **dinamik olasılıksal bir model** olarak görülebilir:
- **Teknik analiz** (trendler ve ATR) birleştirir.
- Olasılıkları **Bayesçi teori** ile iyileştirir.
- Potansiyel gelecekteki fiyat hareketlerini ve ilişkili belirsizlikleri anlamanıza yardımcı olmak için **görsel bir projeksiyon aralığı** sağlar.
⚡ İster **oynak piyasalarda** analiz yapıyor olun, ister **boğa/ayı senaryolarını** doğruluyor olun, bu araç size sağlam, veri odaklı bir yaklaşım sunar! 🚀