
Opis
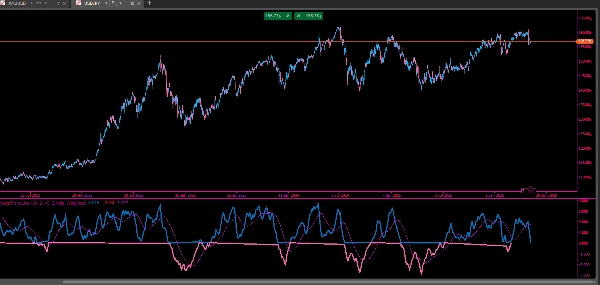
Ten wskaźnik to zmodyfikowana wersja transformacji Fishera zaprojektowana dla cTrader. Przekształca dane cenowe w znormalizowany oscylator, który podkreśla potencjalne punkty zwrotne na rynku.
Oblicza wygładzoną transformację Fishera na podstawie ceny środkowej (średniej z maksimum i minimum) w konfigurowalnym okresie. Transformacja podkreśla ekstremalne ruchy cen, ułatwiając identyfikację szczytów i dołków.
Aby zmniejszyć szumy, surowe wartości Fishera są dodatkowo wygładzane za pomocą dwóch średnich kroczących o konfigurowalnych okresach i typach. Wskaźnik oddziela również dodatnie i ujemne wartości Fishera na dwa wykresy o różnych kolorach (zielony i czerwony), poprawiając czytelność wizualną wokół linii zerowej.
Dodatkowo, linia sygnału (żółta) jest rysowana przy użyciu drugiej średniej kroczącej, pomagając traderom wyraźniej identyfikować kierunek trendu i zmiany momentum.
Ogólnie rzecz biorąc, wskaźnik ten służy do wykrywania odwróceń, podkreślania stanów wykupienia/wyprzedania oraz zapewniania płynniejszego potwierdzenia trendu poprzez warstwowe uśrednianie.
Podsumowanie
To reduce noise, the indicator applies two moving averages with customizable periods and types to smooth the raw Fisher values. It visually separates positive and negative Fisher values into green and red plots, respectively, enhancing clarity around the zero line. Additionally, a yellow signal line derived from the second moving average helps identify trend direction and momentum shifts.
This indicator is primarily used to detect market reversals, highlight overbought and oversold conditions, and provide smoother trend confirmation through layered averaging. It supports trend and market structure analysis and outputs visual signals suitable for bar-based price data.