
الوصف
كيفية عمل مؤشر UTBot (بالإيطالية)
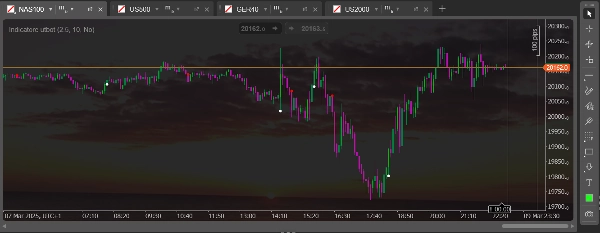
مؤشر UTBot هو أداة تحليل فني تنشئ خط توقف متحرك ديناميكي يعتمد على ATR. يحسب قيمة التوقف باستخدام ATR مضروبًا في عامل الحساسية، مما يخلق دعمًا/مقاومة يتكيف مع التقلبات. يحدد الاتجاهات الصاعدة عندما يبقى السعر فوق هذا الخط والاتجاهات الهابطة عندما يكون تحته. يولد إشارات شراء عندما يعبر السعر الخط من الأسفل إلى الأعلى وإشارات بيع عندما يعبره من الأعلى إلى الأسفل. غالبًا ما يُستخدم تقاطع EMA مع خط التوقف المتحرك كدليل تأكيد. إنه فعال في الأسواق الاتجاهية وفي إدارة التوقفات الديناميكية للمراكز المفتوحة.
UTBot Indicator Functionality (English)
The UTBot indicator is a technical analysis tool that creates a dynamic trailing stop line based on ATR. It calculates a stop value using ATR multiplied by a sensitivity factor, creating support/resistance that adapts to volatility. It identifies uptrends when price stays above this line and downtrends when below. It generates buy signals when price crosses above the line from below and sell signals when crossing below from above. An EMA crossover with the trailing stop line is often used as confirmation. It's effective in directional markets and for managing dynamic stops for open positions.
الملخص
تقييمات العملاء
5 | 100 % | |
4 | 0 % | |
3 | 0 % | |
2 | 0 % | |
1 | 0 % |


