RSI Adjusted SuperTrend
อินดิเคเตอร์
เวอร์ชัน 1.0, Sep 2025
Windows, Mac
คำอธิบาย
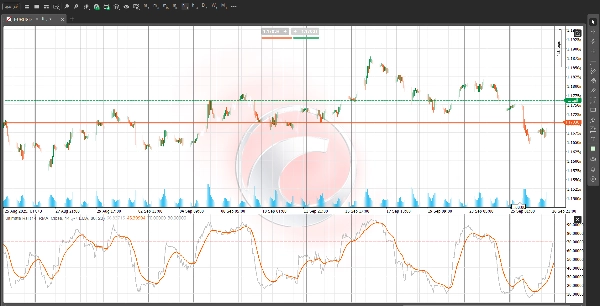
Ultimate RSI (ดัชนีความแข็งแกร่งสัมพัทธ์)
The Ultimate RSI เป็นออสซิลเลเตอร์ขั้นสูงและปรับแต่งพิเศษที่ออกแบบมาเพื่อให้การอ่าน แรงขับเคลื่อนตลาด และ ความแข็งแกร่งของแนวโน้ม ที่นุ่มนวล สะอาด และตอบสนองได้ดีขึ้น มันเป็นการอัปเกรดที่สำคัญเหนือดัชนีความแข็งแกร่งสัมพัทธ์ (RSI) แบบดั้งเดิม โดยเน้นการกรองเสียงรบกวนของตลาดและลดสัญญาณเท็จ (whipsaws) ซึ่งทำให้เป็นเครื่องมือที่มีคุณค่าสำหรับการยืนยันแนวโน้มและการระบุจุดกลับตัวที่เชื่อถือได้
คุณสมบัติหลักและการปรับปรุง:
- การคำนวณแรงขับเคลื่อนที่เพิ่มขึ้น: ตัวบ่งชี้ใช้วิธีที่ซับซ้อนในการคำนวณการเปลี่ยนแปลงราคา แทนที่จะพึ่งพาการเคลื่อนไหวของราคาประจำวันเพียงอย่างเดียว สัญญาณแรงขับเคลื่อนจะได้รับการเสริมอย่างมากเมื่อราคาบันทึกจุดสูงสุดใหม่หรือต่ำสุดใหม่ภายในช่วงเวลาย้อนหลัง กระบวนการนี้ช่วยให้ตัวบ่งชี้ตอบสนองอย่างทรงพลังต่อการเบรคเอาต์ที่แท้จริงในขณะที่ละเลยการเคลื่อนไหวเล็กน้อยและสับสน
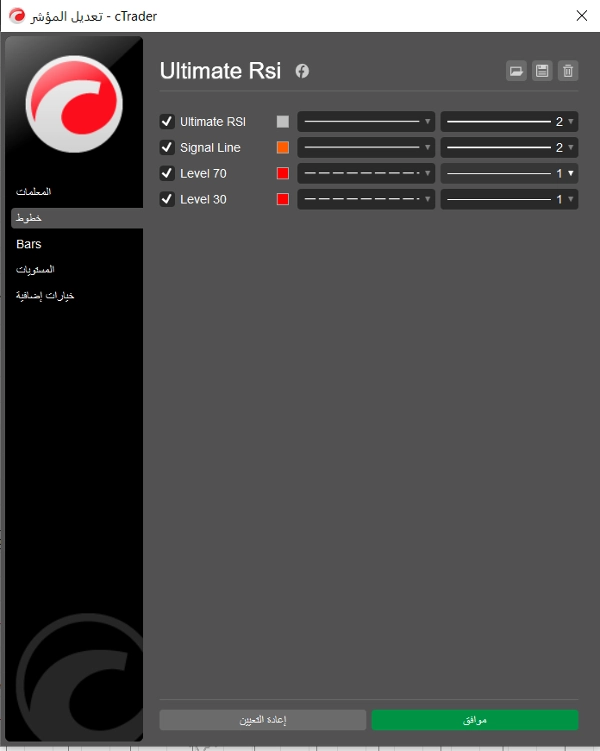
- เส้นสัญญาณเฉพาะ: มันรวมถึง เส้นสัญญาณ ที่แยกต่างหาก (ค่าเฉลี่ยเคลื่อนที่ของ RSI เอง) ซึ่งสามารถตั้งค่าได้อย่างอิสระ การตัดกันระหว่างเส้น Ultimate RSI และเส้นสัญญาณมักถูกใช้เป็นตัวกระตุ้นที่ชัดเจนและมีความมั่นใจสูงสำหรับการเข้าและออก โดยเฉพาะอย่างยิ่งใกล้ระดับซื้อมาก/ขายมาก
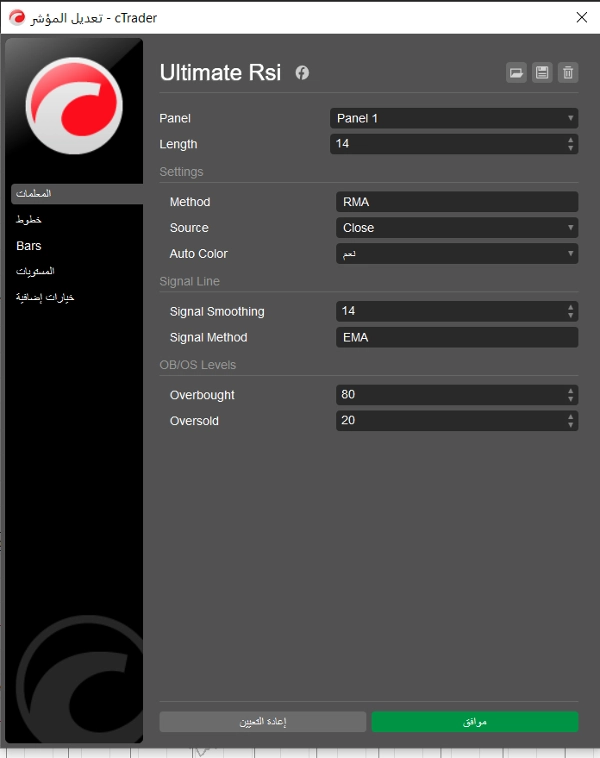
- วิธีการทำให้เรียบที่ยืดหยุ่น: ผู้ใช้มีความยืดหยุ่นในการเลือกประเภทการทำให้เรียบสำหรับการคำนวณ RSI และเส้นสัญญาณจากตัวเลือกทั่วไป: EMA (ค่าเฉลี่ยเคลื่อนที่แบบทวีคูณ), SMA (ค่าเฉลี่ยเคลื่อนที่แบบง่าย), RMA (ค่าเฉลี่ยเคลื่อนที่ของ Wilder) และ TMA (ค่าเฉลี่ยเคลื่อนที่แบบสามเหลี่ยม) ซึ่งช่วยให้ปรับแต่งความไวของตัวบ่งชี้ได้อย่างแม่นยำ
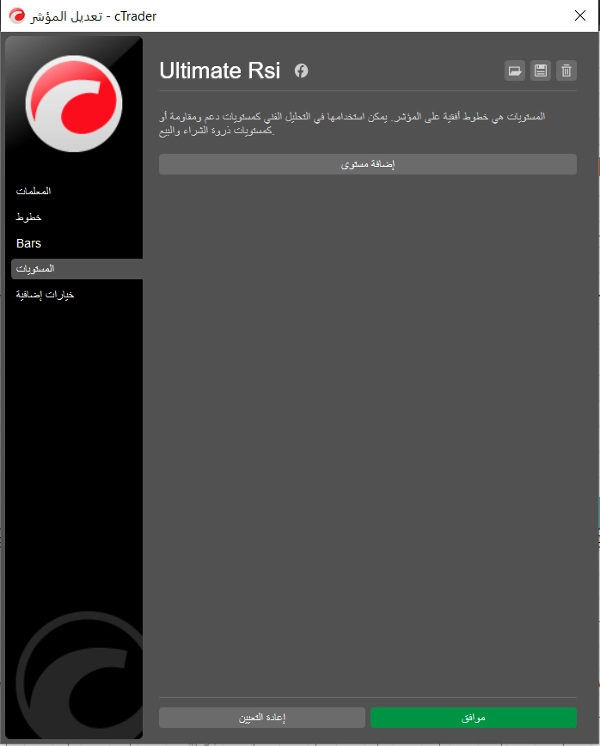
- โซน OB/OS ที่มองเห็นได้: ระดับซื้อมาก (OB) เริ่มต้นที่ 80 และระดับขายมาก (OS) ที่ 20 ถูกทำเครื่องหมายอย่างชัดเจนด้วยการไล่ระดับสีพื้นหลัง ในตลาดที่มีแนวโน้มแข็งแกร่ง การอ่านที่คงอยู่ในโซนเหล่านี้มักบ่งชี้ถึง ความแข็งแกร่งของแนวโน้ม ที่โดดเด่นมากกว่าการกลับตัวทันที ซึ่งเป็นเครื่องมือยืนยันที่ทรงพลังสำหรับกลยุทธ์การติดตามแนวโน้ม
วิธีการเทรดด้วย Ultimate RSI:
- การยืนยันแนวโน้ม: ใช้ ระดับ 50 เป็นศูนย์กลางของแรงขับเคลื่อน การอ่านที่อยู่เหนือ 50 อย่างต่อเนื่องยืนยันความโน้มเอียงขาขึ้น ในขณะที่การอ่านต่ำกว่า 50 ยืนยันความโน้มเอียงขาลง
- สัญญาณเข้า: มองหาเส้น Ultimate RSI ที่ตัดขึ้น เหนือ เส้นสัญญาณสำหรับการเข้าแบบยาว และตัดลง ต่ำกว่า เส้นสัญญาณสำหรับการเข้าแบบสั้น โดยให้ความสนใจอย่างใกล้ชิดกับตำแหน่งที่เกิดการตัดกันเหล่านี้เมื่อเทียบกับระดับ 50
- การลดเสียงรบกวน: ด้วยการเน้นการขยายช่วงจริงและการใช้การทำให้เรียบขั้นสูง Ultimate RSI ช่วยให้เทรดเดอร์รักษาสมาธิในช่วงเวลาการรวมตัว ป้องกันการเข้าออกก่อนเวลาอันควร
ข้อจำกัดความรับผิดชอบ: คำอธิบายนี้มีไว้เพื่อข้อมูลและการศึกษาเท่านั้น การเทรดมีความเสี่ยง และการอ่านตัวบ่งชี้ทั้งหมดควรรวมกับการวิเคราะห์การเคลื่อนไหวของราคาที่ครอบคลุมสำหรับการตัดสินใจเทรดใดๆ
สรุป
โปรไฟล์อินดิเคเตอร์
รีวิวจากลูกค้า
0.0
รีวิว: 0
รีวิวจากลูกค้า
ยังไม่มีรีวิวสำหรับผลิตภัณฑ์นี้ หากเคยลองแล้ว ขอเชิญมาเป็นคนแรกที่บอกคนอื่น!
การสนทนา
คำถามที่พบบ่อย
Prop
Forex
Indices
Supertrend
Commodities
RSI
Crypto
Stocks
ATR
ผลิตภัณฑ์ที่มีให้บริการผ่าน cTrader Store รวมถึงบอทการเทรด อินดิเคเตอร์ และปลั๊กอิน มีให้บริการโดยนักพัฒนาบุคคลที่สามและมีไว้เพื่อวัตถุประสงค์ในการเข้าถึงข้อมูลและทางเทคนิคเท่านั้น cTrader Store ไม่ใช่โบรกเกอร์และไม่ได้ให้คำแนะนำการลงทุน คำแนะนำส่วนบุคคล หรือการรับประกันผลการดำเนินงานในอนาคต


ราคา
ตั้งแต่ 03/09/2025