
Beschreibung
Currency Basket - Benutzerdefinierter zusammengesetzter Indexindikator
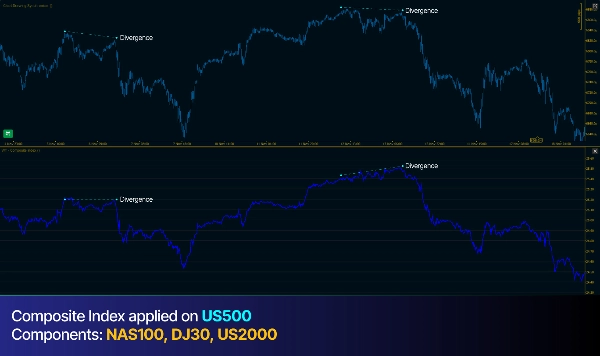
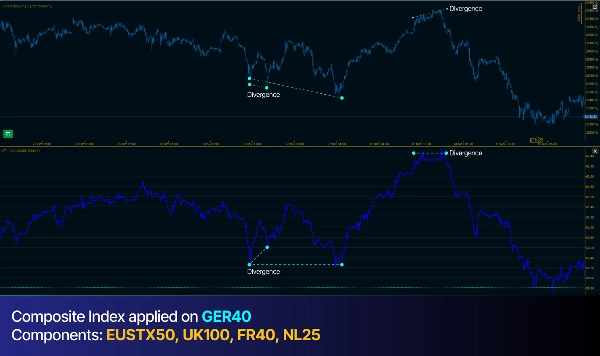
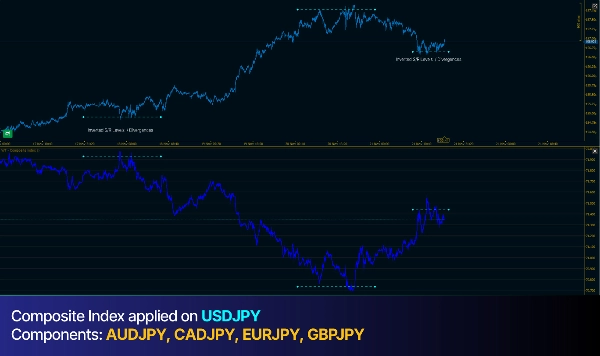
Dieser Indikator kombiniert mehrere Währungspaare zu einem einzigen zusammengesetzten Stärkeindex, der in einem separaten Panel unter Ihrem Chart angezeigt wird. Er erkennt automatisch Pivotpunkte (Fraktale) sowohl in Ihrem Kurschart als auch im Basket-Index und verbindet diese dann mit Trendlinien, um Divergenzen aufzuzeigen.
Version 2.0 - Siehe Reiter Versionshinweise
Offen für zukünftige Updates
-------------------------------------------------------------------------------------------------------------------------------------------------------
Was es macht
-------------------------------------------------------------------------------------------------------------------------------------------------------
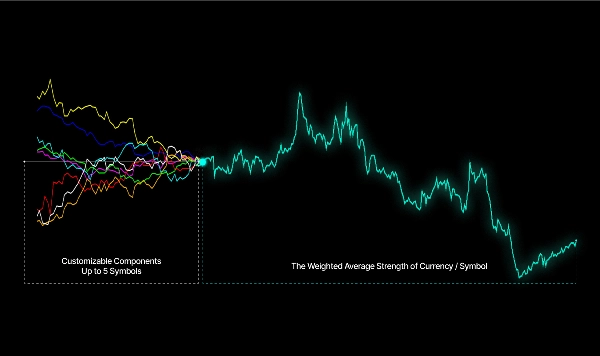
- Zusammengesetzter Basket: Aggregiert 5 Währungspaare (nach Ihrer Wahl) mit gleicher Gewichtung, um einen Stärkeindex zu erstellen
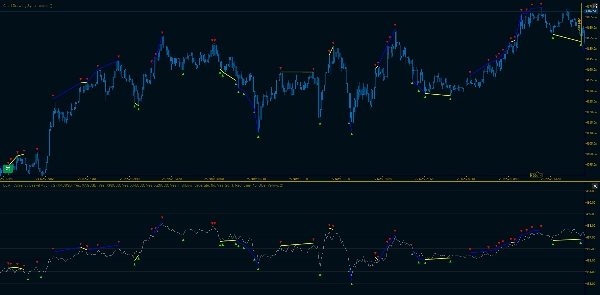
- Automatische Fraktalerkennung: Erkennt Pivot-Hochs und -Tiefs in Ihrem Chart basierend auf konfigurierbaren linken/rechten Balkenzahlen
- Sequenzielle Verfolgung: Verfolgt aufeinanderfolgende Pivotpunkte desselben Typs (Hochs oder Tiefs) und verbindet sie mit Trendlinien
- Hervorhebung von Divergenzen: Färbt Trendliniensegmente automatisch gelb, wenn sich Kurs und Basket in entgegengesetzte Richtungen bewegen (Divergenz), weiß wenn sie zusammen verlaufen
-------------------------------------------------------------------------------------------------------------------------------------------------------
Mehrere Berechnungsmodi für gewichteten Durchschnitt
-------------------------------------------------------------------------------------------------------------------------------------------------------
- Close: Einzelne glatte Linie unter Verwendung der Schlusskurse
- Gewichtet (HL2): Einzelne Linie unter Verwendung des Durchschnitts von Hoch- und Tiefkursen
- Hoch/Tief getrennt: Zwei Linien—hohe Fraktale verglichen mit Basket-Hochs, tiefe Fraktale mit Basket-Tiefs
-------------------------------------------------------------------------------------------------------------------------------------------------------
Anpassbare Einstellungen
-------------------------------------------------------------------------------------------------------------------------------------------------------
- Einzelne Währungspaare aktivieren/deaktivieren
- Einstellbare Empfindlichkeit der Pivot-Erkennung
- Konfigurierbare Farben für Fraktale, Trendlinien und Divergenzen
- Invertierungsoption zur Analyse der Stärke der Notierungswährung
- Skalenmultiplikator für optimale visuelle Darstellung
Der Indikator funktioniert auf jedem Zeitrahmen und spiegelt automatisch alle erkannten Fraktale und Trendlinien zwischen Ihrem Kurschart und dem Basket-Panel für einen einfachen visuellen Vergleich wider.
Zusammenfassung
Kundenbewertungen
5 | 100 % | |
4 | 0 % | |
3 | 0 % | |
2 | 0 % | |
1 | 0 % |


![„[CB] Pivot Points Pro“-Logo](https://cdn.ctrader.com/image/webp/43463c82-67b0-4f10-a4ba-901bba091d81_32594)


