

설명
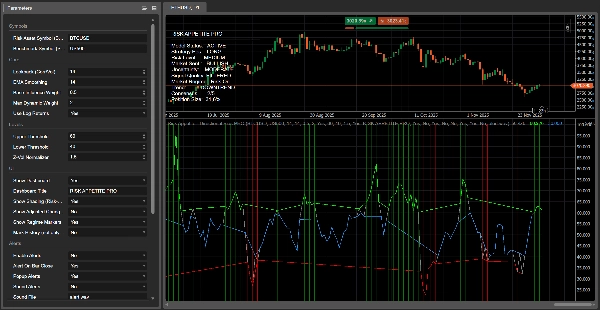
🚀 리스크 애피타이트 & 방향성 바이어스 ULTRA (cTrader)는 리스크 온 / 중립 / 리스크 오프 상태를 측정하고 이를 명확하고 실행 가능한 방향성 바이어스로 변환하도록 설계된 전문 시장 체제 지표입니다. 단일 시장에 의존하는 대신 두 개의 상품(“리스크 프록시”와 “벤치마크”)를 비교하여 실시간 리스크 점수(0–100)를 생성하고, 체제 전환을 강조하며, 모든 것을 차트 내 대시보드 표시를 통해 요약합니다.
🔧 처음 두 매개변수가 의미하는 바 (그리고 왜 중요한지)
🟠 리스크 자산 심볼 (BTC)
이는 리스크 프록시—“리스크 애피타이트 온도계”로 사용되는 상품입니다. 원래 개념에서는 비트코인을 글로벌 리스크 온 프록시로 사용하기 때문에 “BTC”로 표시되지만, 비트코인을 반드시 사용해야 하는 것은 아닙니다. 리스크 심리를 잘 나타내는 어떤 자산으로도 설정할 수 있습니다(예: BTC, NASDAQ/US100, 고베타 지수 등).
🔵 벤치마크 심볼 (SP/US500)
이는 매크로 바이어스를 추적하고자 하는 기준 시장(벤치마크)입니다. 일반적으로 US500/SPX500이지만, 본인이 주요 “컨텍스트 드라이버”로 생각하는 어떤 상품도 될 수 있습니다.
✅ 요약하자면:
- 리스크 자산 = 심리 센서 (리스크 애피타이트 소스)
- 벤치마크 = 바이어스가 반영되길 원하는 기준 시장
❓ 반드시 비트코인에 사용해야 하나요?
아니요. 목표에 따라 지표를 다양한 방식으로 사용할 수 있습니다:
✅ A) 매크로 “클래식” 리스크 온/리스크 오프 (권장)
- 리스크 자산: BTCUSD
- 벤치마크: US500 / SPX500
글로벌 리스크 체제를 명확히 보여줍니다.
✅ B) 매크로 컨텍스트와 함께 비트코인 거래
- 리스크 자산: BTCUSD
- 벤치마크: US500 (또는 다른 매크로 기준)
매크로 조건이 BTC를 지지하거나 반대하는 시점을 이해하는 데 도움이 됩니다.
✅ C) 다중 자산 / 맞춤 시장 관계
- 리스크 자산: BTC 또는 US100
- 벤치마크: 필터링하고자 하는 시장 (GER40, XAUUSD 등)
이 지표를 유연한 “심리 엔진”으로 변환합니다.
⚙️ 작동 원리 (핵심 로직)
모델은 두 심볼 모두에 대해 다음을 계산합니다:
📈 수익률 (%) (더 안정성을 위해 로그 수익률 선택 가능)
📊 변동성 (선택된 조회 기간 동안 표준 편차)
🔗 롤링 상관관계 두 수익률 시리즈 간
🎛️ 동적 가중치로 리스크 프록시의 영향력을 다음에 따라 조정합니다:
- 상관관계 강도
- 상대적 변동성
이것은 조정된 변화 신호를 생성하며, 이는:
- EMA로 부드럽게 처리됨
- 0–100 리스크 점수로 정규화됨
📊 읽는 방법 (가장 중요한 신호)
🎯 리스크 점수 (0–100)는 주요 나침반입니다:
🟢 리스크 온 (상한선 이상 점수, 예: > 60)
→ 리스크 애피타이트가 강하며, 환경이 종종 모멘텀/리스크 자산에 유리함
🔵 중립 (하한선과 상한선 사이, 예: 40–60)
→ 전환 / 횡보 / 혼합 신호, 필터링 권장
🔴 리스크 오프 (하한선 이하 점수, 예: < 40)
→ 방어적 환경, 주의가 높으며 하락 위험이 종종 증가함
🔴 빨간 선이 “끊기는” 이유 (그리고 그 의미)
이 ULTRA 버전에서는 시각화가 의도적이며 “체제 기반”입니다:
- 항상 보이는 연속 기본선(회색)
- 색상 오버레이는 해당 체제에서만 나타납니다:
-
- 빨간색 오버레이는 리스크 오프 동안에만 표시됩니다
- 초록색 오버레이는 리스크 온 동안에만 표시됩니다
- 파란색 오버레이는 중립 동안에 표시됩니다
그래서 시장이 리스크 오프에서 벗어나 중립(또는 리스크 온)으로 이동할 때, 빨간색 오버레이는 빈 값(NaN)이 되어 cTrader가 더 이상 그리지 않습니다—이 때문에 “끊기는” 것처럼 보입니다. ✅
📌 중요한 점: 이것이 자동으로 약세장이 “끝났다”는 의미는 아닙니다.
모델이 더 이상 강력하고 확실한 리스크 오프 상태를 감지하지 못해 약세 우위가 줄어들고 시장이 전환기에 있음을 의미합니다.
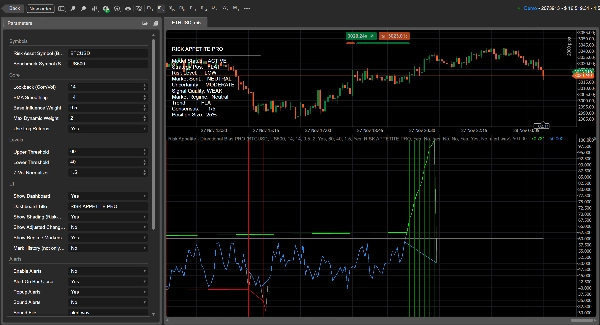
🖥️ 차트 내 표시(대시보드)의 용도 — 항목별 설명
대시보드는 당신의 실시간 의사결정 패널입니다. 체제, 신뢰도, 전술적 지침을 요약하여 단순히 선만 보고 추측할 필요가 없게 합니다.
✅ 모델 상태
모델이 정상적으로 작동하는지 표시합니다.
- 활성 = 유효한 데이터가 있고 계산이 정확함
- 데이터 없음 = 심볼 데이터 누락, 잘못된 심볼 이름, 또는 충분한 이력/시간 정렬 부족
🎯 전략 포지션
체제에 기반한 제안된 입장:
- 롱 = 리스크 온
- 숏 = 리스크 오프
- 플랫 = 중립
⚠️ 리스크 레벨
시장 변동성과 불확실성에 기반한 리스크 강도 측정치입니다.
- 매우 낮음 / 낮음 = 더 안정적인 상태
- 중간 = 정상
- 높음 / 매우 높음 = 더 높은 노이즈, 더 높은 휘핑 위험; 규모 축소 또는 더 강한 확인 요구
🧠 시장 심리
점수 수준에서 도출된 방향성 톤:
- 강세 / 약세 / 중립
🌫️ 불확실성
모델의 “명확성”을 보여줍니다. 다음과 같은 경우 증가합니다:
- 상관관계 약화, 또는
- 변동성 상승 (더 불안정한 환경)
수준: 낮음 / 보통 / 높음
🧪 신호 품질
다음에 기반한 종합 등급:
- 신호 강도 (50에서의 거리)
- 불확실성 수준
출력: 강함 / 필터링됨 / 약함
🔥 시장 체제
주요 분류:
- 리스크 온 / 중립 / 리스크 오프
색상 오버레이, 음영, 포지션 바이어스를 주도하는 핵심 체제 상태입니다.
📉 추세
점수의 단기 방향 (기울기):
- 상승 추세 = 리스크 애피타이트 상승
- 하락 추세 = 리스크 애피타이트 하락
- 횡보 = 횡보 / 낮은 모멘텀
🗳️ 컨센서스 (X/5)
방향, 기울기, 상관관계 정렬 등 주요 조건이 얼마나 일치하는지 계산하는 간단한 정렬 점수입니다.
높을수록 더 명확하고 일관된 환경입니다.
📏 포지션 크기
신호 강도와 불확실성에 기반한 제안된 노출 비율:
- 강하고 불확실성 낮음 → 더 큰 크기 제안
- 약하거나 불확실함 → 더 작은 크기 제안
🧭 다중 타임프레임 장점 (실제로 매우 강력함)
동일한 시장을 여러 타임프레임에서 분석할 때, 지표는 각 타임프레임별로 업데이트되고 재정렬됩니다. 이를 통해 쉽게 파악할 수 있습니다:
✅ 타임프레임 정렬 (더 강한 신호)
✅ 타임프레임 충돌 (종종 더 중립적/횡보 조건)
상위 타임프레임은 매크로 체제를 정의하고, 하위 타임프레임은 해당 체제 내에서 진입 타이밍에 도움을 줍니다.
📌 마커, 알림 & 통지 (ULTRA 기능)
✨ 체제 마커는 체제 변경 시 차트에 표시됩니다:
- 리스크 온 ↔ 중립 ↔ 리스크 오프
전환을 즉시 확인할 수 있게 합니다.
🔔 알림 & 통지를 활성화하여 다음을 받을 수 있습니다:
- 팝업 알림 (선택적 사운드 포함)
- 바 마감 시 알림 (캔들 형성 중 잘못된 트리거 방지를 위해 권장)
💬 (최적화 + 프리셋 + 도구) 커뮤니티에 참여하세요
이 지표에서 최고의 성능을 원하나요? 우리의 Discord에 참여하여 다음을 이용하세요:
✅ 브로커 심볼에 맞춘 매개변수 최적화
✅ 즉시 사용 가능한 프리셋 (암호화폐 / 지수 / FX)
✅ 다중 타임프레임 설정 가이드
✅ 신호 필터링 및 실행 품질을 향상시키는 고급 도구 및 업데이트
요약
고객 리뷰
5 | 100 % | |
4 | 0 % | |
3 | 0 % | |
2 | 0 % | |
1 | 0 % |


