Opis
⭐ STREFA MULTI‑TIMEFRAME SMC™ 🇫🇮
Mapowanie instytucjonalnej podaży i popytu na pięciu ramach czasowych — automatycznie.
Produkt profesjonalny
Silnik Multi‑Timeframe SMC Zone™ to precyzyjnie zaprojektowany wskaźnik Smart Money Concepts, który automatycznie wykrywa, rysuje i synchronizuje instytucjonalne strefy podaży i popytu na pięciu głównych ramach czasowych — wszystko w czasie rzeczywistym, bezpośrednio na Twoim wykresie.
Stworzony dla traderów polegających na strukturze rynku, zachowaniu płynności i śladach instytucjonalnych, ten narzędzie eliminuje zgadywanie i niespójność ręcznego oznaczania stref. Niezależnie od tego, czy handlujesz intraday czy swing, Multi‑Timeframe SMC Zone Engine™ daje Ci kompletną, wielowarstwową mapę miejsc, gdzie rynek najprawdopodobniej zareaguje.
To nie jest tylko wskaźnik.
To wieloramowy system inteligencji SMC.
Kluczowe możliwości
Automatyczne wykrywanie stref podaży i popytu
Silnik skanuje ostatnie X świec (zdefiniowane przez użytkownika) na każdej ramie czasowej i identyfikuje:
Strefy popytu (niedobory bycze)
Strefy podaży (niedobory niedźwiedzie)
Strefy są weryfikowane za pomocą struktury świec — co zapewnia wyświetlanie tylko istotnych śladów instytucjonalnych.
Pięć ram czasowych, jeden wykres
Wskaźnik analizuje jednocześnie
Dzienną
4-godzinną
1-godzinną
30-minutową
15-minutową
Każdej ramie czasowej przypisany jest unikalny kolor, co daje czysty, warstwowy widok siły wyższych ram czasowych i precyzji niższych.
Ta wieloramowa fuzja to podstawa, na której traderzy SMC opierają przewidywanie zmiotów płynności, bloków mitigacyjnych oraz stref premii/zniżki.
Dynamiczne projekcje stref
Każda strefa jest automatycznie rozszerzana do najnowszej świecy, co pozwala zobaczyć:
Gdzie cena prawdopodobnie zareaguje
Które strefy są nadal aktywne
Jak aktualna cena współgra ze śladami instytucjonalnymi
Brak ręcznego przerysowywania. Brak bałaganu. Brak przestarzałych stref.
Profesjonalna wizualizacja
Każda strefa zawiera:
Kolorowy prostokąt z regulowaną szerokością obramowania
Czytelną etykietę tekstową („Popyt: H1”, „Podaż: M15” itd.)
Inteligentne przesunięcie w lewo, aby uniknąć nakładania się świec
Efektem jest czysta, czytelna, profesjonalna mapa SMC.
Dlaczego traderzy to kochają
Eliminuje ręczne oznaczanie stref
Zapewnia natychmiastowy kontekst wieloramowy
Pomaga identyfikować punkty reakcji o wysokim prawdopodobieństwie
Działa z każdą strategią opartą na SMC, ICT, Wyckoff lub koncepcjach płynności
Czysta wizualizacja, która nie przytłacza wykresu
Idealne zarówno dla intraday scalperów, jak i swing traderów
To narzędzie daje Ci perspektywę instytucjonalną — bez zbędnej złożoności.
Dla kogo jest ten wskaźnik
Traderzy Smart Money Concepts
Traderzy płynności w stylu ICT
Traderzy struktury rynku i przepływu zleceń
Scalperzy potrzebujący precyzji
Traderzy swing potrzebujący kontekstu wyższych ram czasowych
Każdy, kto chce mieć czystą, zautomatyzowaną mapę podaży/popytu
⭐ STREFA MULTI‑TIMEFRAME SMC™
Handluj z jasnością śladów instytucjonalnych — na każdej ważnej ramie czasowej
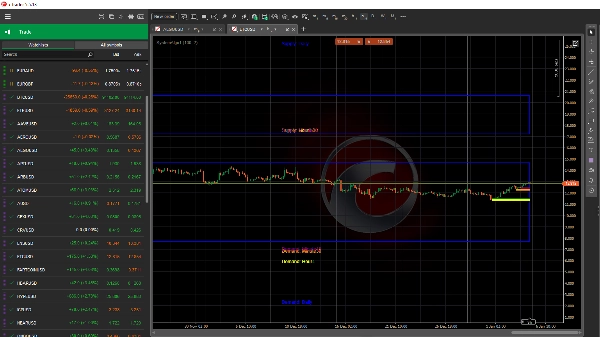
Uwagi
Niebieski = dzienny popyt/podaż
Zielony = 4-godzinny popyt/podaż
Żółty = 1-godzinny popyt/podaż
Ciemny fiolet = 15-minutowy popyt/podaż
Różowy = 5-minutowy popyt/podaż
gdy nakładają się > większe prawdopodobieństwo udanego handlu
Podsumowanie
The indicator assigns unique colors to each timeframe’s zones for clear, layered visualization, enabling traders to assess higher-timeframe strength alongside lower-timeframe precision. Zones are dynamically extended to the latest candle, showing active areas where price is likely to react without manual redrawing or clutter.
Each zone is visually marked with a colored rectangle, adjustable border width, and clear text labels indicating timeframe and zone type, placed to avoid overlap with price candles. This tool supports trading strategies based on market structure, liquidity, and institutional footprints, including SMC, ICT, Wyckoff, and liquidity concepts.
SystemAlgo1 is suitable for intraday scalpers and swing traders seeking automated, multi-timeframe supply and demand mapping to identify high-probability reaction points across markets such as Forex, cryptocurrencies, indices, commodities, and stocks.