
Beschreibung
Das Problem: Informationsüberflutung
Die meisten Trader scheitern, weil ihre Charts mit nachlaufenden Indikatoren und zu vielen Linien überladen sind. Sie verlieren das Wichtigste aus den Augen: Marktstruktur.
Die Lösung: Trend Bias Struktur
Dieser Indikator ist eine „Zwei-in-Eins“-Kraftpaket für die cTrader-Plattform. Er kombiniert professionelle Swing-Erkennung mit einer objektiven Bewertungs-Engine, die Ihnen genau sagt, wer den Markt kontrolliert.
Hauptmerkmale:
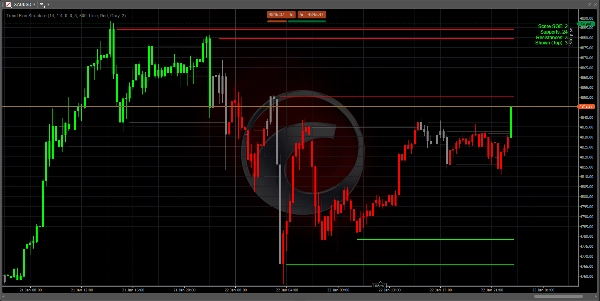
- Intelligente Strukturabbildung: Identifiziert automatisch bedeutende Unterstützungs- und Widerstandsniveaus unter Verwendung von ATR-gefilterter Volatilität.
- Die SGE-Bewertungs-Engine: Ein einzigartiges Bewertungssystem (-2, 0, +2), das die Trendstärke basierend darauf berechnet, wie viele strukturelle Niveaus durchbrochen wurden.
- Anti-Clutter-Technologie: Zeigt nur die 3 nächstgelegenen relevanten Niveaus zum aktuellen Preis an. Ihr Chart bleibt sauber, professionell und handlungsfähig.
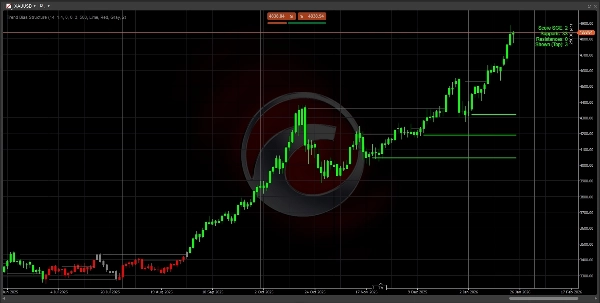
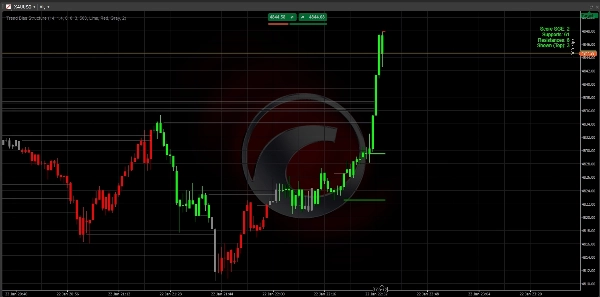
- Momentum-Erkennung: Verwendet die „Big Candle“-Logik, um sicherzustellen, dass Sie nur Bewegungen mit echter institutioneller Unterstützung handeln.
- Vollständig anpassbar: Passen Sie die Empfindlichkeit an Ihr spezifisches Asset an (XAUUSD, Forex oder Indizes).
So handeln Sie damit:
- Überprüfen Sie die Bewertung: Achten Sie auf +2 (bullisch) oder -2 (bärisch).
- Warten Sie auf den Rücksetzer: Lassen Sie den Preis zu einer der gezeichneten Struktur-Linien zurückkehren.
- Ausführen: Handeln Sie mit der Tendenz und verwenden Sie die Niveaus als Ihre Ein- und Ausstiegspunkte.
Technische Spezifikationen
- Plattform: cTrader
- Sprache: C# (.NET)
- Zeitrahmen: Funktioniert auf allen Zeitrahmen (M1 bis monatlich).
- Assets: Optimiert für Paare mit hoher Liquidität (XAUUSD, EURUSD, GBPUSD).
Hinweis: Anfängereinstellungen: Für die meisten Hauptpaare sind die Standardeinstellungen optimiert. Wenn Sie volatile Indizes handeln, sollten Sie den Range Global ATR Mult auf 2.0 erhöhen.
Wichtig: Das Dashboard lesen
Das Dashboard in der oberen rechten Ecke ist Ihr Kommandozentrum:
- Bewertung +2 (Grün): Stark bullisch. Suchen Sie nur nach Kauf-Setups.
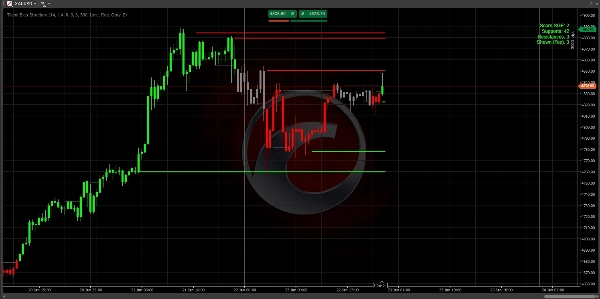
- Bewertung -2 (Rot): Stark bärisch. Suchen Sie nur nach Verkauf-Setups.
- Bewertung 0 (Grau): Neutral. Der Markt bewegt sich seitwärts oder befindet sich im Übergang. Bleiben Sie geduldig.
- Unterstützungen/Widerstände: Zeigt, wie viele historische „Böden“ und „Decken“ im aktuellen Trend existieren.
3-Schritte-Einstiegsstrategie
Schritt 1: Bias identifizieren Warten Sie, bis die Kerzenfarben und die Dashboard-Bewertung +2 oder -2 erreichen. Dies bestätigt, dass der Markt die Struktur durchbrochen hat und ein Trend beginnt.
Schritt 2: Der Wertbereich Jagen Sie dem Preis nicht hinterher. Warten Sie, bis der Preis zu einem der nächsten 3 Linien auf Ihrem Chart zurückzieht.
- In einem Abwärtstrend (Bewertung -2) warten Sie, bis der Preis eine rote Linie berührt.
- In einem Aufwärtstrend (Bewertung +2) warten Sie, bis der Preis eine grüne Linie berührt.
Schritt 3: Ausführung Gehen Sie in den Trade, wenn der Preis die Linie berührt und eine Ablehnung zeigt (ein Docht bildet sich).
- Stop Loss: Platzieren Sie Ihren SL knapp hinter der Struktur-Linie.
- Take Profit: Zielen Sie auf die nächste Struktur-Linie in Trendrichtung.
Profi-Tipps für den Erfolg
- Höhere Zeitrahmen-Regel: Eine Bewertung von +2 auf dem H4 oder D1 Chart ist viel aussagekräftiger als eine Bewertung auf dem M5-Chart. Verwenden Sie den höheren Zeitrahmen, um den Bias zu finden, und den niedrigeren Zeitrahmen, um Ihren Einstieg zu bestimmen.
- Saubere Charts: Wenn der Bildschirm überladen wirkt, gehen Sie in die Einstellungen und ändern Sie
Max Levels to Showauf 2. So werden nur die wichtigsten „Böden“ und „Decken“ angezeigt. - Die „Null“-Zone: Wenn die Bewertung 0 ist, „rechnet“ der Markt neu. Dies ist die beste Zeit, um Gewinne aus vorherigen Trades mitzunehmen und auf einen neuen Ausbruch zu warten.
Fehlerbehebung
- Keine Linien sichtbar? Prüfen Sie, ob Sie genügend Historie in Ihrem Chart geladen haben. Der Indikator benötigt mindestens 100-200 Balken, um ATR- und Swing-Niveaus zu berechnen.
- Indikator-Verzögerung? Wenn Ihr PC langsam ist, reduzieren Sie die
Max Historical LinesEinstellung auf 200, um den Speicher schneller zu leeren.
Häufig gestellte Fragen (FAQ)
F: Repaintet dieser Indikator?
A: Nein. Die Niveaus und Bewertungen werden basierend auf bestätigten Kerzenschlüssen berechnet. Sobald ein Niveau durchbrochen oder eine Bewertung zum Kerzenschluss geändert wird, ist es in der Historie festgeschrieben.
F: Welcher Zeitrahmen ist am besten?
A: Die Logik ist universell. Die meisten professionellen Trader verwenden ihn jedoch auf H1, H4 oder Tages-Charts, um die „institutionelle Struktur“ zu identifizieren. Wenn Sie auf M1 oder M5 scalpieren, erwarten Sie häufigere Bewertungsänderungen.
F: Kann ich diesen Indikator mit anderen Indikatoren verwenden?
A: Ja! Er funktioniert perfekt als „Richtungsfilter“. Zum Beispiel nehmen Sie nur RSI-Überverkauft-Signale, wenn der Trend Bias Score +2 ist.
Viel Erfolg beim Trading!
Keine Finanzberatung. Der Trend Bias Structure Indikator ist ein technisches Analysewerkzeug, das Trader dabei unterstützt, Marktstruktur und Trendbias zu erkennen.
Zusammenfassung
Key features include:
- Smart Structure Mapping: Automatically detects significant support and resistance levels filtered by ATR-based volatility.
- SGE Scoring Engine: Calculates trend strength by counting breached structural levels.
- Anti-Clutter Display: Shows only the three closest relevant levels to maintain chart clarity.
- Momentum Detection: Uses "Big Candle" logic to highlight moves with institutional backing.
- Customizable sensitivity for different assets such as XAUUSD, EURUSD, GBPUSD, and indices.
The indicator works on all timeframes from 1 minute to monthly, with professional traders typically using H1, H4, or daily charts to identify institutional structure. The dashboard provides a clear bias score and structural levels to guide trade entries and exits. Users are advised to trade with the bias, waiting for price pullbacks to the nearest structure lines before executing trades.
This tool is intended as a directional filter and can be combined with other indicators like RSI. It does not repaint, as calculations are based on confirmed candle closes.
Kundenbewertungen
5 | 100 % | |
4 | 0 % | |
3 | 0 % | |
2 | 0 % | |
1 | 0 % |


