
Dominator M4tr1x
Dies ist ein grundlegendes Informationswerkzeug, das die Analyse der Smart-Money-Preisstruktur im Chart mit mehreren Informations-Dashboard-Panels kombiniert. Hier ist eine Aufschlüsselung jedes Hauptsystems:
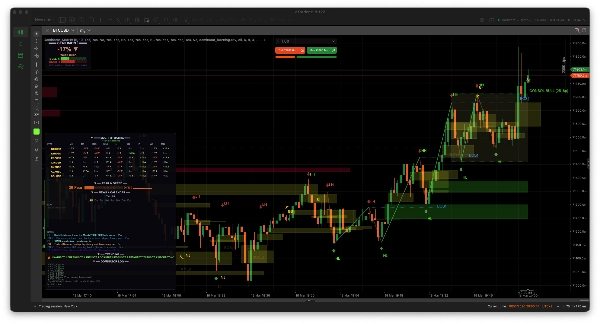
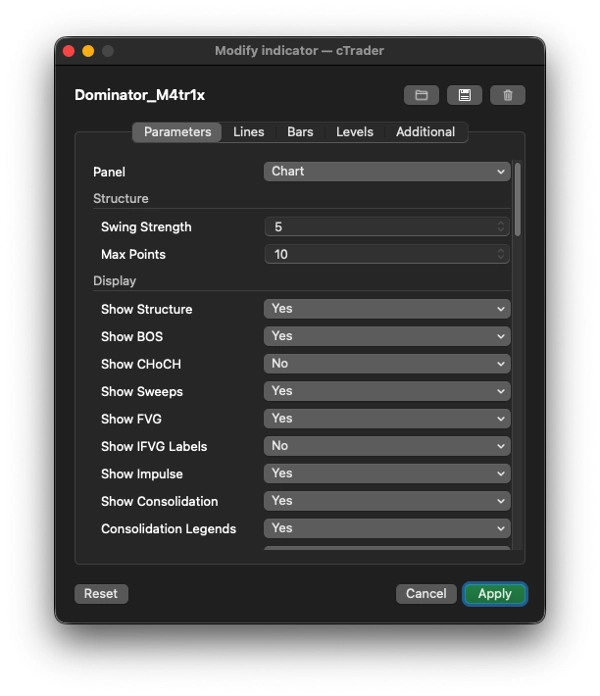
1. 📊 IM CHART: Smart Money Struktur Analyse
Zeichnet direkt im Preischart:
Funktion
Was es tut ;
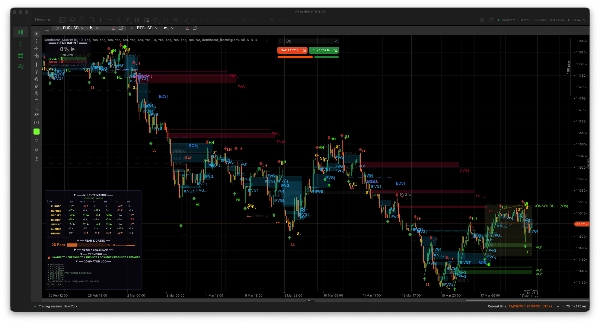
Swing-Erkennung
Identifiziert Swing-Hochs/-Tiefs mit einer konfigurierbaren Rückblickstärke, markiert sie mit Pfeilen (▲/▼)
Struktur-Labels
Kennzeichnet jeden Swing als HH (Higher High), HL (Higher Low), LH (Lower High), LL (Lower Low), um die Marktstruktur abzubilden
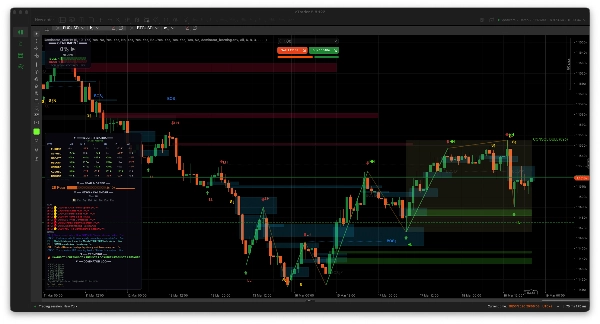
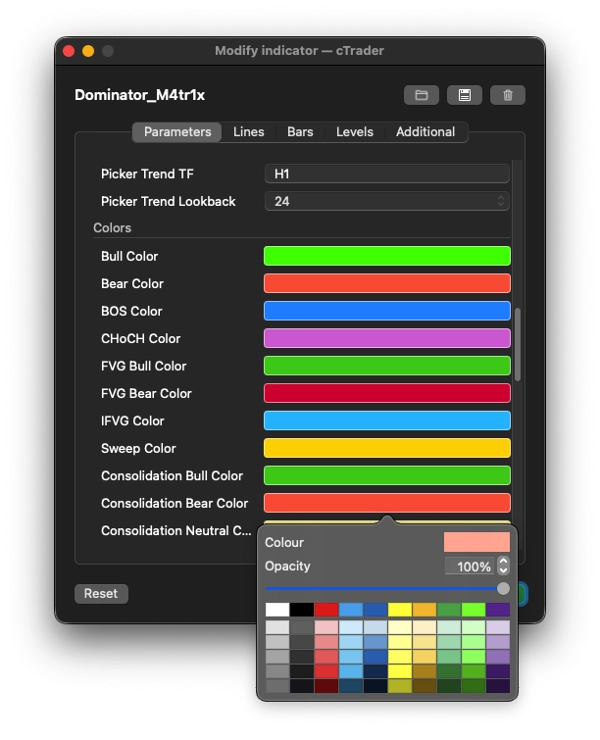
BOS (Break of Structure)
Zeichnet gepunktete Linien + Labels, wenn der Preis ein vorheriges Swing-Hoch/-Tief in Trendrichtung durchbricht
CHoCH (Change of Character)
Wie BOS, aber gegen den Trend — signalisiert eine mögliche Trendwende
Break-Invalidierung
Wenn der Preis durch eine BOS/CHoCH-Ebene zurückkehrt, wird dies als fehlgeschlagen markiert (ausgegraut mit ✗) und protokolliert
Liquiditäts-Sweeps
Erkennt, wenn der Preis über ein Swing-Hoch (oder unter ein Swing-Tief) aussticht, aber wieder innerhalb schließt — ein klassisches Liquiditäts-Erfassungsmuster
FVG (Fair Value Gaps)
Erkennt 3-Kerzen-Ungleichgewichte (Lücken zwischen dem Hoch der Kerze 1 und dem Tief der Kerze 3). Zeichnet farbige Rechtecke im Chart
IFVG (Inverse FVG)
Wenn der Preis zurückkehrt, um ein FVG zu füllen, wird es als "IFVG" bezeichnet (die Lücke wird zu einer potenziellen Unterstützungs-/Widerstandszone)
FVG-Invalidierung
Wenn der Preis entschlossen durch eine FVG-Zone schließt, wird sie als ungültig markiert
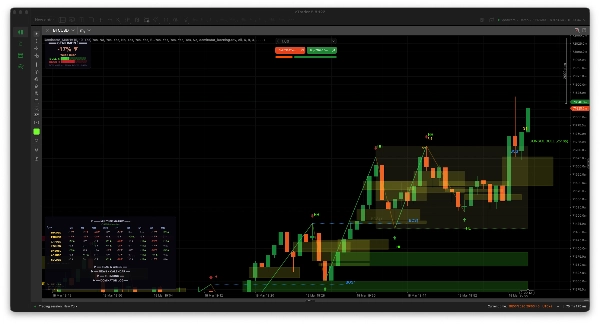
Impulswellen
Verbindet Swing-Punkte mit Trendlinien — grün für Impulsstrecken (mit Trend), gelb für Korrekturstrecken
Konsolidierungszonen
Erkennt, wenn aufeinanderfolgende Swing-Hochs und -Tiefs innerhalb einer engen, auf ATR basierenden Spanne liegen, zeichnet ein Rechteck mit einem "CONSOL BULL/BEAR/NEUTRAL"-Label, das Richtungsbias und Pip-Breite anzeigt
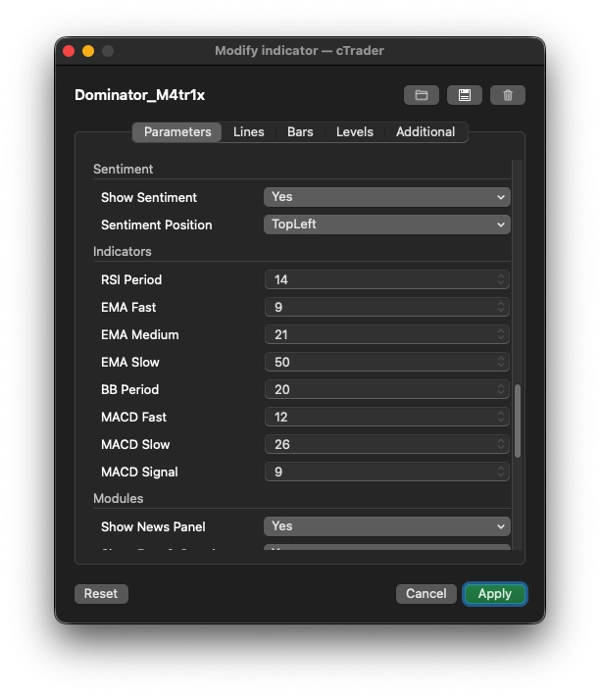
2. 📈 SENTIMENT-PANEL (standardmäßig oben links)
Ein Echtzeit-Bullen/Bären-Bewertungsmesser für das aktuelle Chart-Symbol/Zeitrahmen unter Verwendung von:
- RSI (überverkauft/überkauft + Divergenzerkennung)
- MACD (Kreuzungen, Histogramm-Momentum)
- 3 EMAs (schnelle/mittlere/langsame Ausrichtung und Preisposition relativ zu ihnen)
- Bollinger-Bänder (Preis an oberen/unteren Bandextremen)
Zeigt an:
- Eine Prozentbewertung von -100% bis +100% (z.B. "+67% STARKER BULLEN")
- Visuelle Bullen- vs. Bären-Punktbalken (█████░░░░)
- Laufende Signalstatistiken (Gesamtsignale, bestätigt, ungültig, Genauigkeit %)
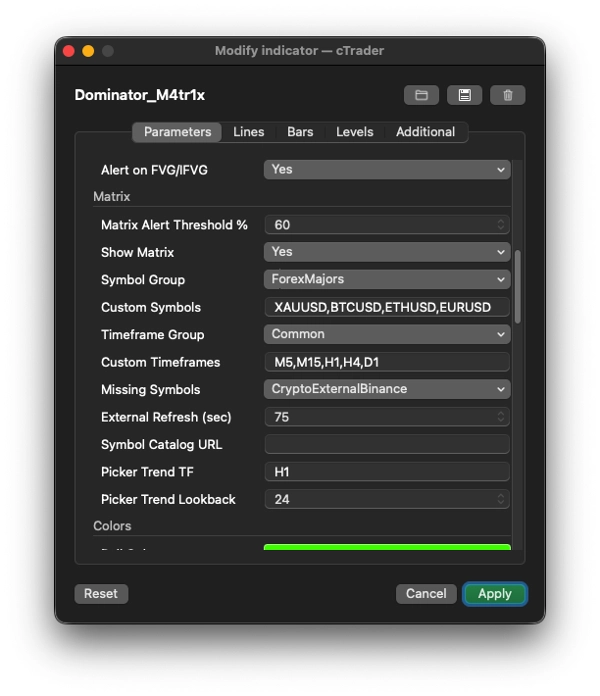
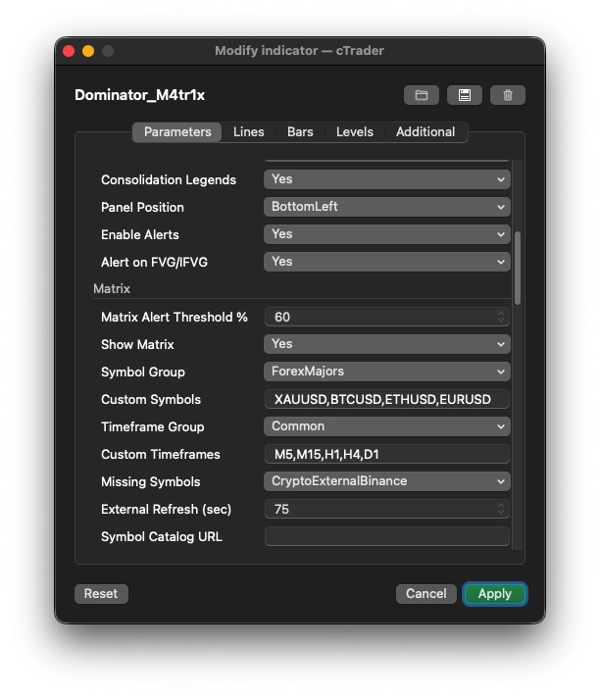
3. 🔢 MULTI-TIMEFRAME-MATRIX (Hauptpanel)
Ein Raster/Heatmap, das Bullen-/Bären-Sentimentbewertungen über mehrere Symbole × mehrere Zeitrahmen gleichzeitig anzeigt.
Aspekt
Details
Symbolgruppen
Forex Majors/Minors/Exotics, Krypto, Indizes, US-Aktien, Metalle, Energie, Rohstoffe oder Benutzerdefiniert
Zeitrahmengruppen
Gängig (M5–W1), Alle oder Benutzerdefiniert
Jede Zelle
Zeigt eine farbcodierte Bewertung wie "+42▲" (grün) oder "-67▼" (rot) mit derselben RSI/MACD/EMA/BB-Bewertungs-Engine
Symbolauflösung
Extrem robust — erkennt automatisch Broker-Namenskonventionen (Suffixe wie .r, m, .cash, Schrägstriche wie EUR/USD), probiert Dutzende Alias-Varianten, speichert Ergebnisse im Cache
Externe Daten
Für Symbole, die der Broker nicht anbietet (insbesondere Krypto), werden OHLC-Daten von Binance, Bybit, OKX, Kraken, Bitfinex APIs abgerufen (kostenlos, kein Schlüssel erforderlich)
Premium-APIs
Optional unterstützt TwelveData, AlphaVantage, Polygon, Stooq für Aktien/Indizes/Forex über API-Schlüssel
Interaktiv
Klicken Sie auf einen Symbolnamen → öffnet einen durchsuchbaren Symbolauswähler mit über 100 Symbolen aus allen Kategorien, zeigt 24h %-Änderung. Klicken Sie auf einen Zeitrahmen-Header → öffnet einen Zeitrahmen-Auswähler zum Spaltenwechsel
Alarme
Wenn eine Zelle einen konfigurierbaren Schwellenwert überschreitet (z.B. ±60%), wird ein Alarmton abgespielt
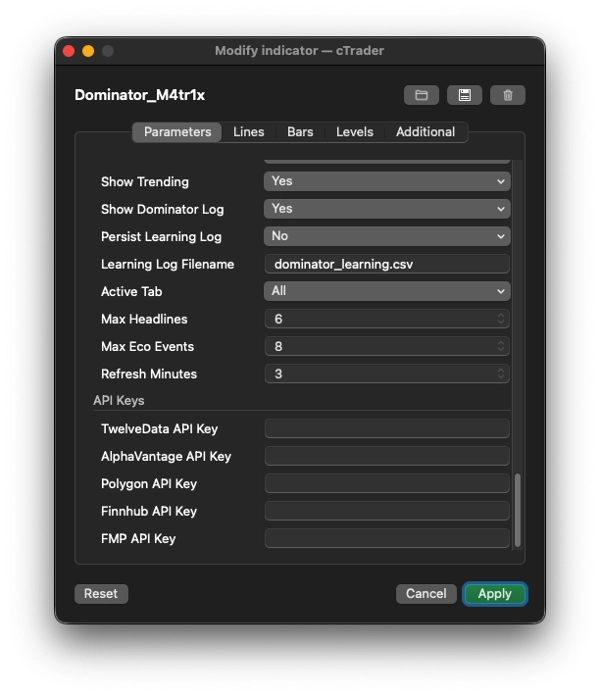
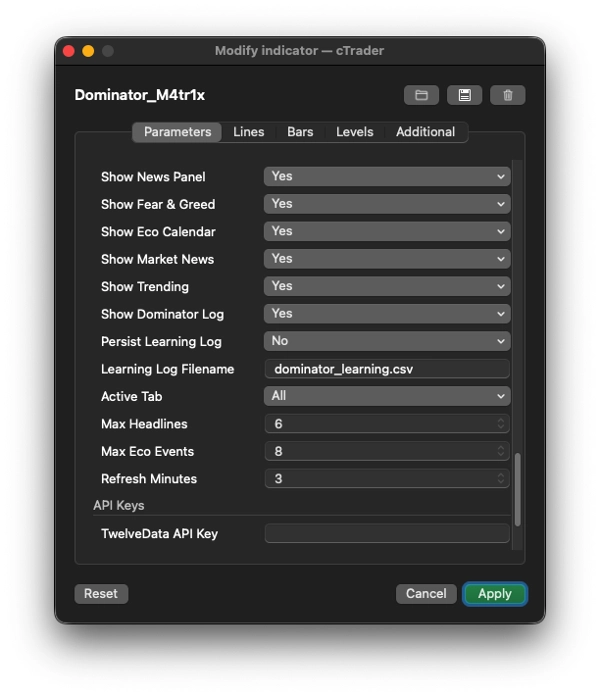
4. 📰 NACHRICHTEN- + INFORMATIONSPANELS
Wirtschaftskalender
Fasst bevorstehende Wirtschaftsereignisse mit hoher/mittlerer Auswirkung aus 8+ redundanten Quellen zusammen:
- ForexFactory (JSON + XML), TradingView, Finnhub, TradingEconomics, MQL5, FXStreet, FMP (FinancialModelingPrep)
- Farbkodiert nach Dringlichkeit (rot = JETZT, orange = <15 Min, gelb = <1 Stunde, grün = später)
Marktnachrichten-Schlagzeilen
Fasst zusammen aus 12+ RSS/API-Quellen:
- Krypto: CryptoCompare, CoinDesk, CoinTelegraph, NewsBTC, Binance-Ankündigungen, OKX-Systemstatus
- Forex: FXStreet, ForexLive
- Indizes/Aktien: MarketWatch, CNBC, Reuters, Yahoo Finance
- Automatische Kategorisierung der Schlagzeilen (Krypto/Forex/Metalle/Energie/Aktien) durch Stichworterkennung
- Filterbar nach Registerkarte (Alle, Forex, Krypto, Metalle, Indizes, Aktien, Energie, Wirtschaft)
Fear & Greed Index
- Ruft den Crypto Fear & Greed Index ab (alternative.me API, mit CNN Business Fallback)
- Zeigt numerischen Wert (0–100), Label (Extreme Angst → Extreme Gier), Farbskala und 7-Tage-Sparkline-Verlauf (▁▂▃▄▅▆▇█)
Trending
- Ruft Top-Krypto-Bewegungen vom Binance 24-Stunden-Ticker ab (Top 5 Gewinner + Top 5 Verlierer)
- Fällt zurück auf CoinGecko Trending oder CoinPaprika
5. 📝 DOMINATOR-LOG + LERNSYSTEM
- Führt ein laufendes Signalprotokoll mit den letzten 8 Signalen und Status (● aktiv, ✓ bestätigt, ✗ ungültig)
- Verfolgt die gesamte Genauigkeitsstatistik (Gesamtsignale, bestätigte Ausführungen, Ungültigmachungen, Genauigkeit %)
- Optionale CSV-Persistenz: schreibt jedes Signalereignis (neu/bestätigt/ungültig) in eine CSV-Datei (
dominator_learning.csv) mit vollständigen Metadaten — konzipiert für zukünftiges maschinelles Lernen oder Backtesting
6. 🛠 Technische Architektur-Highlights
- Vollständige Überlagerung (
IsOverlay = true) — zeichnet im Preischart, nicht in einem separaten Panel - AccessRights = None — läuft in der Sandbox des Brokers (kein Dateisystem-/Netzwerkzugriff über das von cAlgo Erlaubte hinaus)
- Asynchrone Datenabfrage — alle HTTP-Aufrufe laufen in Hintergrund-Threads via
Task.Run(), um das Chart nie zu blockieren - Intelligentes Caching — Symbolauflösung, externe OHLC-Daten, Tickerpreise und Trendprozentsätze werden alle mit konfigurierbaren Aktualisierungsintervallen zwischengespeichert
- Automatischer Wiederholungsversuch — fehlgeschlagene Symbolauflösungen und externe Datenabfragen werden alle 45 Sekunden erneut versucht
- Einklappbare Abschnitte — jeder Panel-Abschnitt (Matrix, Fear & Greed, News, Trending, Log) kann durch Klicken auf die Überschrift ein- oder ausgeklappt werden
Zusammenfassung
Dominator M4tr1x ist ein informativer Indikator, der ein komplettes Trading-Dashboard ersetzt. Er bildet die Smart-Money-Struktur im Chart ab (BOS, CHoCH, FVGs, Sweeps, Konsolidierung), bewertet Multi-Asset/Multi-Timeframe-Sentiment über technische Indikatoren, fasst Wirtschaftskalender und Marktnachrichten aus über 20 Quellen zusammen, verfolgt Fear & Greed, zeigt trendende Assets, protokolliert alle eigenen Signale mit Genauigkeitsverfolgung und ermöglicht interaktives Tauschen von Symbolen und Zeitrahmen — und das alles, während fehlende Daten im Hintergrund von über 5 externen Exchange-APIs abgerufen werden.
5 | 0 % | |
4 | 100 % | |
3 | 0 % | |
2 | 0 % | |
1 | 0 % |