Beschreibung
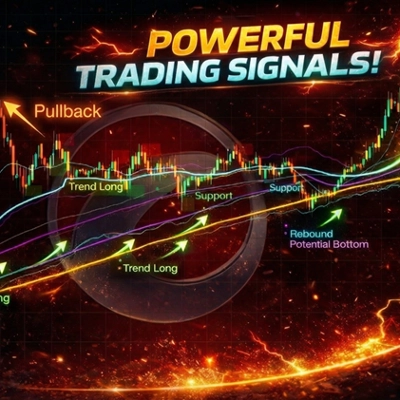
Trend SR System ist ein trendorientierter Chart-Indikator, der Tradern dabei hilft, den Marktkontext, die wichtige EMA-Struktur, dynamische Unterstützungs-/Widerstandsniveaus und potenzielle Fortsetzungs- oder kurzfristige Mittelwertumkehrzonen klarer zu erkennen.
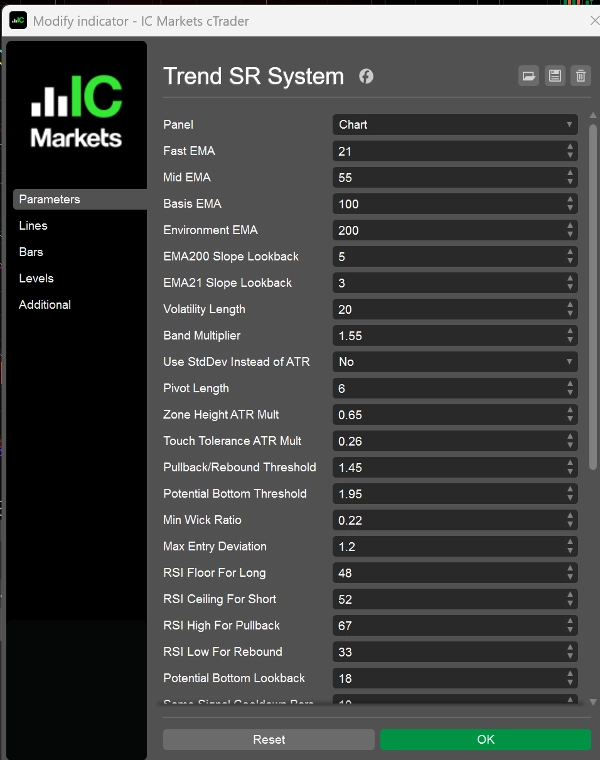
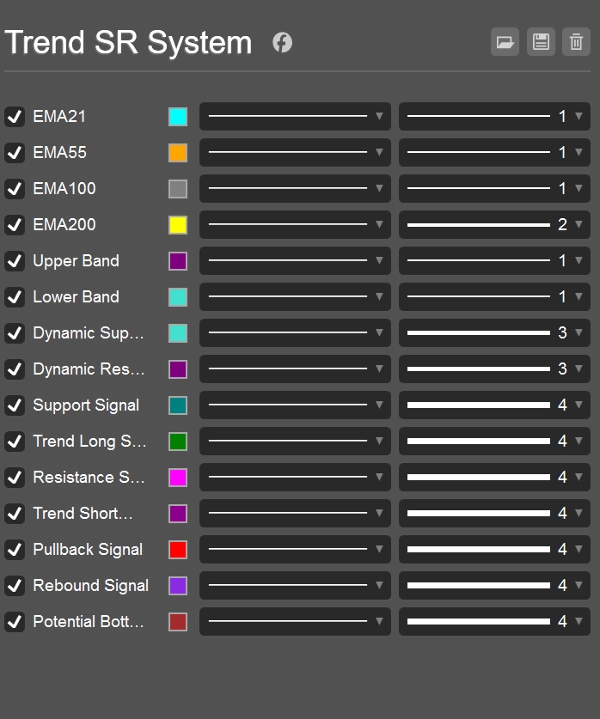
Der Indikator basiert auf EMA21, EMA55, EMA100 und EMA200:
- EMA200 wird als Filter für das übergeordnete Marktumfeld verwendet
- EMA100 fungiert als zentrale Preisschiene und Band-Basislinie
- EMA55 hilft, mittelfristigen Unterstützungs- und Widerstands-Druck zu identifizieren
- EMA21 wird verwendet, um kurzfristigen Rhythmus, Rücksetzer und Korrekturen zu verfolgen
Darüber hinaus kombiniert der Indikator Volatilitätsbänder, pivot-basierte Strukturzonen und eine stufenartige dynamische Unterstützungs-/Widerstandslogik, um eine strukturiertere Marktansicht zu bieten.
Hauptmerkmale
- Zeigt 4 wichtige EMA-Struktur-Linien an
- Zeigt obere und untere Bänder basierend auf ATR oder Standardabweichung
- Erzeugt dynamische Unterstützungs- und Widerstandsniveaus
- Erkennt strukturelle Unterstützungs-/Widerstandsbereiche mittels Pivot-Logik
- Bietet Fortsetzungs- und kurzfristige Korrektur-Signale
- Ermöglicht das Ein- oder Ausschalten einzelner Signaltypen
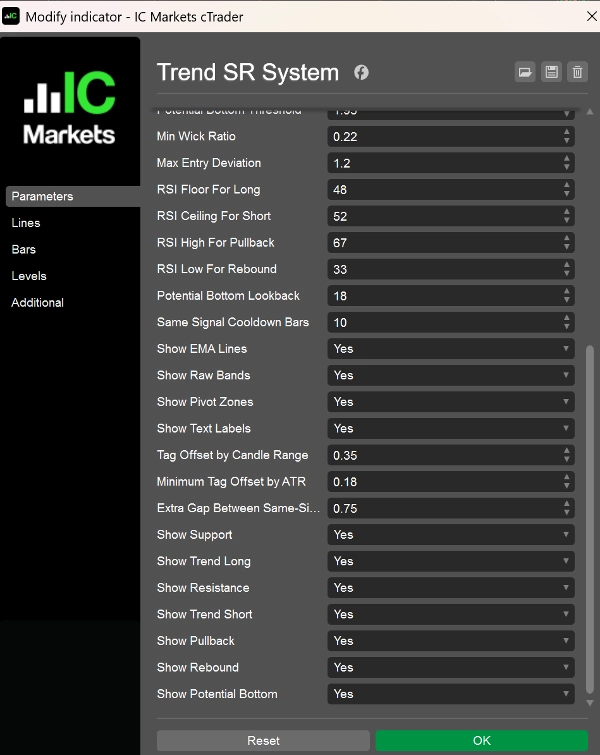
Signaltypen
- Unterstützung
Ein wichtiger Unterstützungsbereich in einem bullischen Umfeld, der darauf hinweist, dass der Preis nach einem Rücksetzer verteidigt wird. - Trend Long
Ein trendfolgendes Long-Signal in einem bullischen Markt, das typischerweise nach einem Rücksetzer erscheint, wenn die Aufwärtsdynamik wieder einsetzt. - Widerstand
Ein wichtiger Widerstandsbereich in einem bärischen Umfeld, der darauf hinweist, dass der Preis nach einer Korrektur gedeckelt wird. - Trend Short
Ein trendfolgendes Short-Signal in einem bärischen Markt, das typischerweise nach einem Schwächeverlust des Rebounds und der Wiederaufnahme des Abwärtstrends erscheint. - Pullback
Eine kurzfristige Überdehnungswarnung in einem bullischen Umfeld, die auf ein mögliches Risiko für Rücksetzer oder Konsolidierung hinweist. - Rebound
Eine kurzfristige Überverkauft-Warnung in einem bärischen Umfeld, die auf ein mögliches Risiko für eine technische Gegenbewegung hinweist. - Potentieller Boden
Ein stärkeres Überverkauft-Erholungs-Signal, das einen möglichen Versuch zur Bildung eines temporären Bodens hervorhebt.
Typische Anwendungsfälle
Dieser Indikator eignet sich für:
- Trendfolgende Analyse
- Timing für Einstieg bei Rücksetzern und Korrekturen
- Beobachtung der EMA-Struktur und Unterstützung/Widerstand
- Überwachung von überdehnten bullischen oder bärischen Bedingungen
- Chartbasierte Handelsfilterung und diskretionäre Entscheidungsunterstützung
Er kann in Forex, Indizes, Metallen, Krypto und anderen trendenden Märkten verwendet werden.
Am besten geeignet für
Dieser Indikator ist für Trader konzipiert, die:
- Eine klarere und strukturiertere Chartansicht wünschen
- Sich auf Trendfortsetzung und wichtige Reaktionszonen konzentrieren
- EMA-Struktur zusammen mit Preisverhalten und Unterstützung/Widerstand nutzen
- Visuelle Handelsunterstützung für kurz- bis mittelfristige Setups bevorzugen
Hinweise zur Verwendung
- Am besten zusammen mit Marktkontext und solidem Risikomanagement verwenden
- Signale sollten nicht als alleinige Handelsberatung betrachtet werden
- Signalqualität kann bei unruhigen oder volatilitätsarmen Marktbedingungen abnehmen
- Dies ist als Chartanalyse- und Handelsunterstützungstool gedacht, nicht als System mit garantierter Performance
Zusammenfassung
Kundenbewertungen
5 | 0 % | |
4 | 100 % | |
3 | 0 % | |
2 | 0 % | |
1 | 0 % |


![„Smart Money Concepts (SMC) [Iridio Capital]“-Logo](https://cdn.ctrader.com/image/webp/28b69fd1-ef54-4bed-9487-07e78e883be4_40934)


