
Beschreibung
VoltyBands ist ein adaptiver, volatilitätsbasierter Indikator, der das Preisverhalten dynamisch verfolgt und Marktbedingungen durch reaktionsfähige obere und untere Bänder visualisiert. Im Gegensatz zu statischen Kanalindikatoren passt sich VoltyBands in Echtzeit an, um Verschiebungen in der Volatilität widerzuspiegeln und Händlern zu helfen, Phasen der Preisexpansion und -kontraktion besser zu verstehen.
Durch die Kombination adaptiver Bandberechnungen mit einer optional geglätteten Signallinie bietet VoltyBands einen klaren Rahmen zur Analyse des Momentums, zur Identifizierung potenzieller Umkehrzonen und zur Erkennung von Konsolidierungsphasen.
Hauptmerkmale
- Adaptive Volatilitätsbänder
Bänder erweitern und verengen sich automatisch basierend auf der aktuellen Marktaktivität. - Nullzentrierter Modus
Option zur Anzeige der Preisbewegung relativ zu einer zentralen Basislinie für verbesserte Klarheit. - Normalisierungsoption
Ermöglicht eine konsistente Skalierung, wodurch der Vergleich von Signalen über verschiedene Instrumente und Zeitrahmen hinweg erleichtert wird. - Integrierter gleitender Durchschnitt
Eingebaute Glättung mit wählbaren Methoden (SMA, EMA, SMMA, LWMA). - Anpassbare Anzeige
Optionale Mittellinie und flexible Visualisierungseinstellungen.
Anwendung
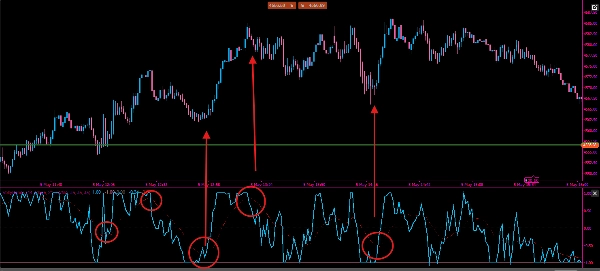
- Momentum-Erkennung
Wenn sich der Preis der oberen Band nähert, kann dies auf bullische Stärke hinweisen, während die Nähe zum unteren Band auf bärischen Druck hindeutet. - Umkehrzonen
Extreme Abweichungen von der Mittellinie können Bereiche hervorheben, in denen der Preis umkehren könnte. - Volatilitätsanalyse
Sich erweiternde Bänder zeigen zunehmende Volatilität an; sich verengende Bänder deuten auf Konsolidierung hin. - Signalbestätigung
Verwenden Sie den gleitenden Durchschnitt als zusätzlichen Filter für Ein- oder Ausstiege.
Parameter
- Länge – Definiert die Empfindlichkeit der Volatilitätsberechnung
- Quelle – Eingabepreis (Schluss, Eröffnung, etc.)
- MA-Periode – Periode für die Glättungslinie
- MA-Methode – Typ des gleitenden Durchschnitts (SMA, EMA, SMMA, LWMA)
- Mittellinie anzeigen – Umschalten der Mittellinie
- Nullbindung – Aktiviert die nullbasierte Visualisierung
- Normalisieren – Aktiviert die normalisierte Skalierung
Praktische Anwendung
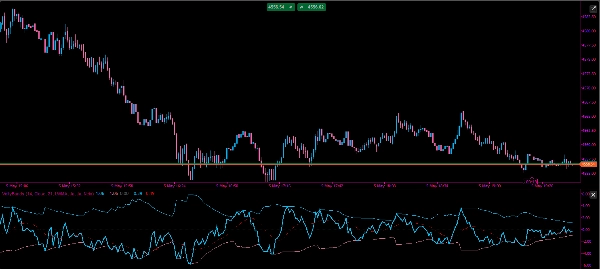
VoltyBands kann verwendet werden, um sowohl Momentum als auch Marktstruktur in Echtzeit zu bewerten. Wenn der Preis nahe am oberen Band bleibt, deutet dies auf anhaltenden bullischen Druck hin, während eine konstante Interaktion mit dem unteren Band bärische Bedingungen anzeigt.
In Seitwärtsmärkten können Händler darauf achten, dass sich der Preis zwischen den Bändern bewegt und die äußeren Niveaus als potenzielle Bereiche für eine Mittelwertumkehr nutzen. Im Gegensatz dazu kann der Preis während starker Trends eine Seite des Bandes „reiten“, was eher auf eine Fortsetzung als auf eine Umkehr hinweist.
Die Mittellinie kann als dynamisches Gleichgewichtsniveau dienen. Überschreitungen über oder unter dieser Linie können als Richtungsindikatoren verwendet werden, insbesondere in Kombination mit dem integrierten gleitenden Durchschnitt zur Bestätigung.
Im normalisierten Modus können Werte als relative Extreme interpretiert werden, was die Identifizierung überdehnter Zustände unabhängig vom Instrument oder Zeitrahmen erleichtert.
Wie bei jedem Indikator ist VoltyBands am effektivsten, wenn es zusammen mit der Kursentwicklung und zusätzlichen Bestätigungstools verwendet wird.