

Descrição
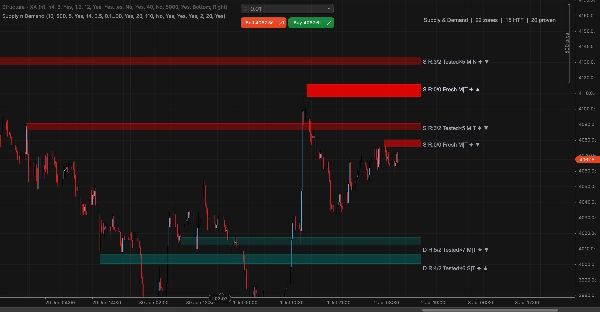
Detecção de zonas de Oferta e Demanda a partir de pivôs swing, com confluência multitemporal e filtragem de volume. As zonas projetam 20 barras à frente e acompanham cada reteste e rompimento - a opacidade da zona diminui com o tempo, zonas com confluência MTF recebem uma borda sólida, e a inversão de papel transforma zonas rompidas para o lado oposto.
Cada zona possui um rótulo compacto com todos os sinais de qualidade: tipo O/D, contagem de retestes/rompimentos, frescor (Fresco/Testado×N), explosividade (Forte/Moderado/Fraco), rigidez da base (Apertada/Normal/Larga), confluência HTF (✦), e volume na formação (▲/▼). Zonas Frescas + ✦ + ▲ são de qualidade máxima - intocadas, confirmadas pela estrutura H4, e formadas em volume elevado.
➤ RECURSOS
• Detecção de pivôs swing com período configurável (padrão 20 no M15)
• Porta rígida HTF H4 — apenas zonas que se sobrepõem à estrutura H4 são criadas (opcional)
• Proteção multi-toque — zonas devem sobreviver a N retestes antes que o rompimento seja contado
• Filtro de volume — zonas formadas com volume de ticks acima da média recebem a tag ▲
• Inversão de zona / reversão de papel — Oferta rompida torna-se Demanda (e vice-versa)
• Desvanecimento visual — opacidade diminui com os toques; fade% global controla a transparência
• Bordas de limite TrendLine — recortadas na extensão da zona, mais fortes para zonas HTF
• Painel compacto — contagem de zonas, contagem HTF, contagem de zonas comprovadas no canto superior direito
• Preservação de zonas comprovadas — zonas com 3+ toques nunca expiram
➤ GRUPOS DE PARÂMETROS
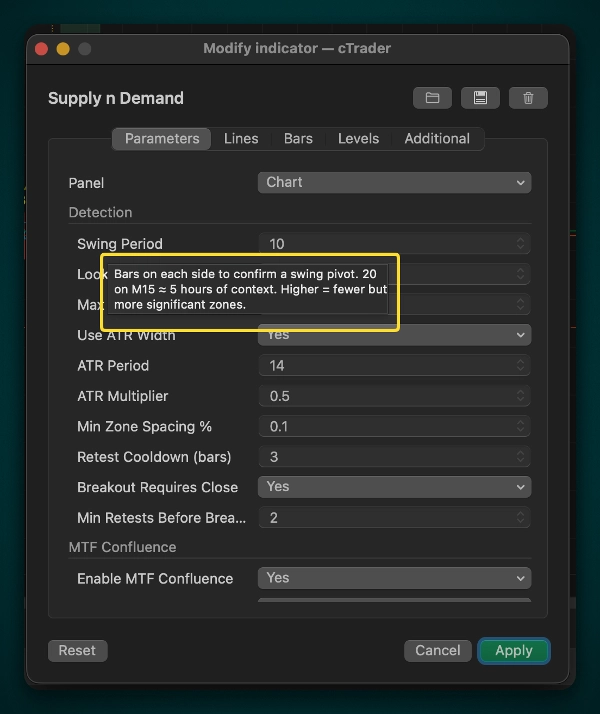
Detecção — Período Swing, multiplicador/tamanho ATR, regras de rompimento, cooldown de reteste
Confluência MTF — referência H4, alternância de porta rígida HTF, swing/lookback HTF
Confluência de Volume — MA de volume, % de limiar, supressão de baixo volume
Estilo — cores, espessura da borda, visibilidade do rótulo
Visual — fade% global, alternância do painel
➤ FLUXO DE TRADING
1. Identifique zonas de alta qualidade: Fresca, ✦, ▲, base apertada
2. Aguarde o preço alcançar a zona — NÃO entre apenas no toque
3. Aguarde confirmação do candle (engolfo, pin bar, martelo na Demanda; estrela cadente, engolfo na Oferta)
4. Stop loss além do limite da zona + buffer; TP na próxima zona oposta
5. Para inversões: aguarde reteste APÓS o rompimento, depois o candle de confirmação
➤ CONFIGURAÇÕES RECOMENDADAS
• Scalping (M1-M5): Swing=8, ATR=1.0, HTF=H1, RequireHTF=false
• Intraday (M15-M30): Swing=20, ATR=1.5, HTF=H4, RequireHTF=true (padrão)
• Swing (H1-D1): Swing=20, ATR=2.0, HTF=D1/W1, RequireHTF=true
➤ LENDO O RÓTULO
Cada zona tem um rótulo em sua borda direita com informações compactadas de qualidade. Exemplo: S R:3/2 Tested×5 M|N ✦ ▼
Detalhamento
- S / D - Oferta (resistência) ou Demanda (suporte)
- R:3/2 - Retestes:3 / Rompimentos:2 — zona resistiu 3 vezes, foi rompida 2 vezes
- Testado×5 - Toques totais (retestes + rompimentos = 5) — indicador de frescor
- M|N - Explosividade|Base: M=Moderado, N=largura normal da base
- ✦ - Confluência HTF confirmada — zona sobrepõe uma zona H4 do mesmo tipo
- ▼ / ▲ - Volume na formação: ▲=acima da média (forte), ▼=abaixo da média (mais fraco)
Como Ler as Zonas de Relance
- Fresca + ✦ + ▲ — qualidade máxima: intocada, confirmada por timeframe superior, formada em volume elevado
- Testado×5-7 — zona foi trabalhada várias vezes, a probabilidade de resistir diminui a cada toque
- Quanto mais transparente (desbotada) uma zona — menor o volume de formação ou mais toques ela tem. O alfa visual mostra instantaneamente quais zonas estão "gastadas"
Este indicador é apenas para análise. Ele não realiza operações. Sempre teste em uma conta demo antes de operar ao vivo.
Resumo
Each zone features a compact label displaying key quality signals: zone type (Supply or Demand), retest and breakout counts, freshness, explosiveness, base tightness, higher timeframe confluence, and volume at formation. Zones formed on above-average tick volume and confirmed by H4 structure are marked as highest quality.
Key features include configurable swing pivot detection, optional H4 hard gate filtering, multi-touch protection requiring zones to survive multiple retests before breakout recognition, volume-based filtering, visual fading of zones with age or touches, and preservation of proven zones with three or more touches. A compact dashboard shows zone counts and quality metrics.
Parameters cover detection settings, multi-timeframe and volume confluence, visual style, and dashboard options. Recommended settings vary by trading style, from scalping to swing trading. The indicator provides visual support and resistance levels with detailed quality metrics for analysis but does not execute trades.
Avaliações de clientes
5 | 100 % | |
4 | 0 % | |
3 | 0 % | |
2 | 0 % | |
1 | 0 % |

Conversa
Perguntas frequentes
Mais deste autor


















Preço