
Beschreibung
- MiniBull MTF Observer
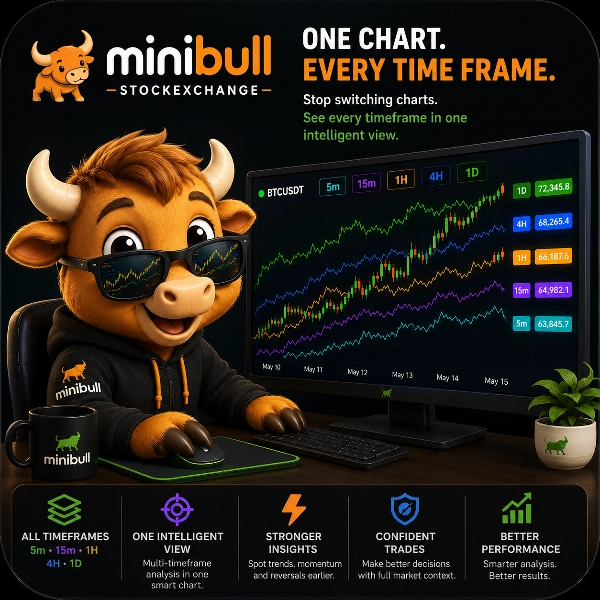
- Ein Indikator. Jeder Zeitrahmen. Kein Chartwechsel.
- KURZBESCHREIBUNG
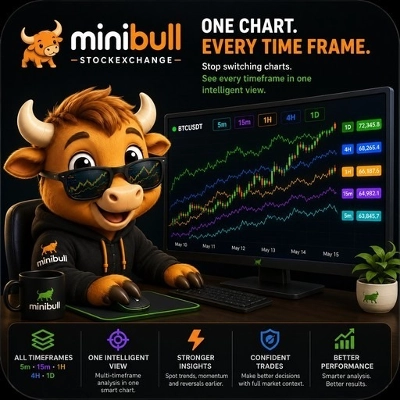
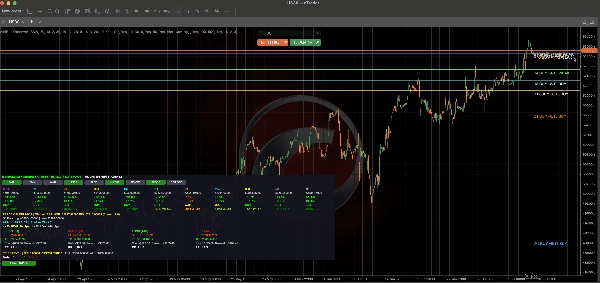
- Sehen Sie 11 Zeitrahmen, eine zusammengesetzte Signalsumme, einen integrierten Handelsrechner und wichtige Preisniveaus-Analysen – alles von einem einzigen, umschaltbaren Dashboard in Ihrem Chart.
- VOLLE BESCHREIBUNG
- MiniBull MTF Observer ist ein Multi-Timeframe-Marktanalyse-Dashboard, das für Trader entwickelt wurde, die nicht zwischen Charts springen wollen, um das Gesamtbild zu erhalten.
- Anstatt M1, M5, M15, M30, H1, H4, H8, H12, D1, W1 und MN1 einzeln durchzugehen, berechnet und zeigt MiniBull alle 11 Zeitrahmen gleichzeitig an – Position des gleitenden Durchschnitts, Trendrichtung und eine gewichtete zusammengesetzte Punktzahl – in einem kompakten, einklappbaren Dashboard.
- - Multi-Timeframe-Übersicht
- Sehen Sie sofort, ob der Preis über oder unter seinem gleitenden Durchschnitt in jedem Zeitrahmen von M1 bis Monatlich liegt, mit Abstand in Pips und Prozent sowie einem klaren KAUF / VERKAUF / WARTEN-Signal für jeden.
- - Zusammengesetzte Signalsumme (0-13)
- Jeder Zeitrahmen erhält eine gewichtete Punktzahl, die RSI, MACD, Stochastik, CCI, Momentum und mehrere MA-Kreuzungen (SMA5, SMA20, EMA21, EMA50) kombiniert – so können Sie die Signalstärke auf einen Blick einschätzen, anstatt fünf separate Indikatoren zu lesen.
- - Auswahl des gleitenden Durchschnitts
- Wechseln Sie direkt über die Dashboard-Schaltflächen zwischen SMA, EMA und KAMA (Kaufmans Adaptive Moving Average) – kein erneutes Öffnen der Einstellungen erforderlich.
- - Integrierter Handelsrechner
- Berechnet automatisch SL/TP-Niveaus und Risiko/Ertrag für Long- und Short-Setups mit zwei Methoden nebeneinander:
- - Vorherige D1 Hoch-/Tief-Level
- - ATR-basierte Stops (Wilders ATR, konfigurierbare Multiplikatoren)
- - Analyse der Preisniveaus
- Verfolgt, wie oft der Preis das aktuelle Niveau historisch getestet hat, wie oft er nach oben vs. unten durchbrochen wurde, und kennzeichnet All-Time-High / All-Time-Low / First-Time-At-Level Bedingungen – so erhalten Sie Kontext, bevor Sie einen Trade eingehen.
- - D1 Level-Benachrichtigungen
- Erhalten Sie Benachrichtigungen (Ton und/oder E-Mail), wenn der Preis das Hoch/Tief des Vortages erreicht oder durchbricht und wenn ein Zeitrahmen in eine starke Kauf-/Verkaufszone wechselt.
- - Sauberes, einklappbares Dashboard
- Das Dashboard sitzt ruhig in der unteren linken Ecke und ist standardmäßig geschlossen – klicken Sie auf die Umschalttaste, wann immer Sie die vollständige Aufschlüsselung wünschen. MA-Linien bleiben jederzeit im Chart dargestellt, unabhängig vom Dashboard-Zustand, sodass Ihr Chart nie den Kontext verliert.
- - Vollständig anpassbar
- Passen Sie MA/RSI/MACD/Stochastik/CCI/Momentum-Perioden, ATR-Multiplikatoren, Alarmbereiche, Farben, Schriftgröße und Panel-Position an Ihren eigenen Handelsstil an.
- WARUM TRADER MINIBULL NUTZEN
- - Hören Sie auf, zwischen Chartfenstern zu wechseln, um höhere/niedrigere Zeitrahmen zu prüfen
- - Erkennen Sie Ausrichtungen (oder Konflikte) über Zeitrahmen hinweg in Sekunden
- - Erhalten Sie objektive SL/TP-Vorschläge statt zu raten
- - Wissen Sie sofort, ob Sie in der Nähe eines historisch bedeutenden Niveaus handeln
- Funktioniert mit jedem Symbol und jedem Chart-Zeitrahmen.
Zusammenfassung
Indikatorprofil
Indikatorkategorie
Trend
Ausgabetyp
Visualisierung
Datenanforderungen
Nur Balken
Unterstützte Signale
Trendstärke
Eröffnungsspanne der Sitzung
Ausbruch
Level – Durchbrechen
Level – Berührung
Volatilität
Wendepunkt
Abweichung
Durchbrechen
Kundenbewertungen
0.0
Bewertungen: 0
Kundenbewertungen
Bisher gibt es keine Bewertungen für dieses Produkt. Haben Sie es schon ausprobiert? Dann können Sie die erste Person sein, die andere darüber informiert!
Diskussion
Häufig gestellte Fragen (FAQ)
Inside Bar
EMA
SMA
Key Levels
ATR
Moving Average
Support & Resistance
Über den cTrader Store verfügbare Produkte, einschließlich Handelsbots, Indikatoren und Plugins, werden von externen Entwicklern bereitgestellt und nur zu Informations- und technischen Zugriffszwecken verfügbar gemacht. cTrader Store ist kein Broker und erbringt keine Anlageberatung, persönlichen Empfehlungen oder eine Garantie für zukünftige Performance.