"Stochastic RSI Indicator" logo
Stochastic RSI Indicator
0.0
06/08/2025
18
Desktop

📈 Stochastic RSI

The Stochastic RSI indicator is a momentum oscillator that applies the Stochastic formula to RSI values rather than price, making it a second-derivative indicator. It is particularly useful for identifying overbought and oversold conditions with higher sensitivity than the standard RSI.
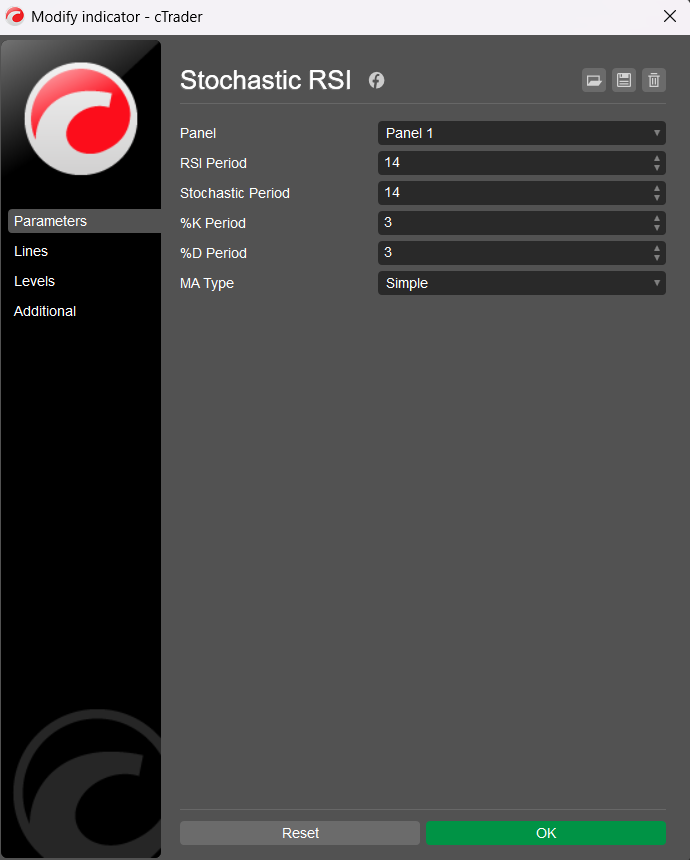
🛠️ Parameters

RSI Period: The lookback period used to calculate the base RSI (default = 14)

Stochastic Period: The lookback period applied to RSI values to compute Stochastic RSI (default = 14)

%K Period: The smoothing period for the %K line (default = 3)

%D Period: The smoothing period for the %D line (default = 3)

MA Type: Moving average type for smoothing: Choice of 11 types (default = Simple)
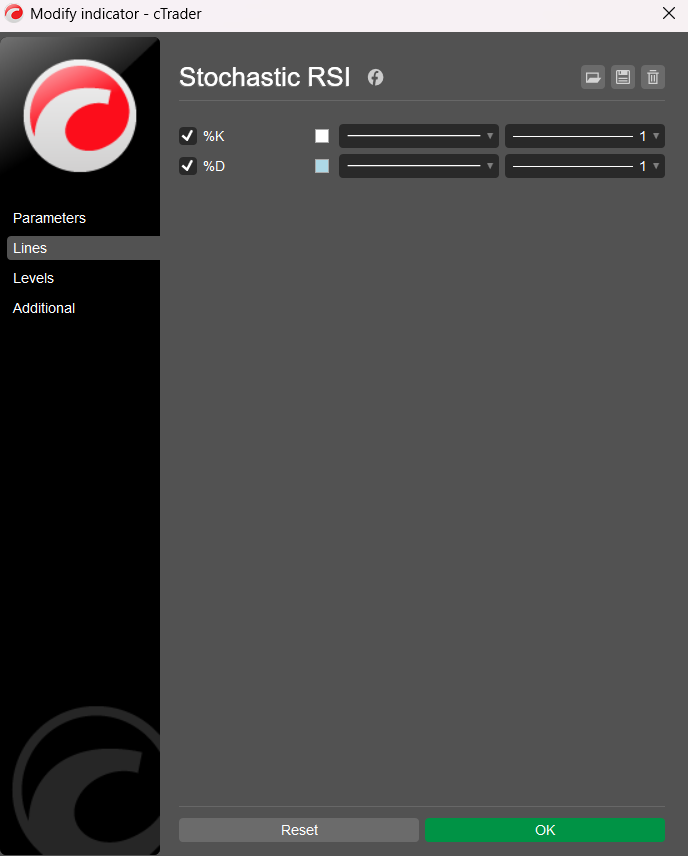
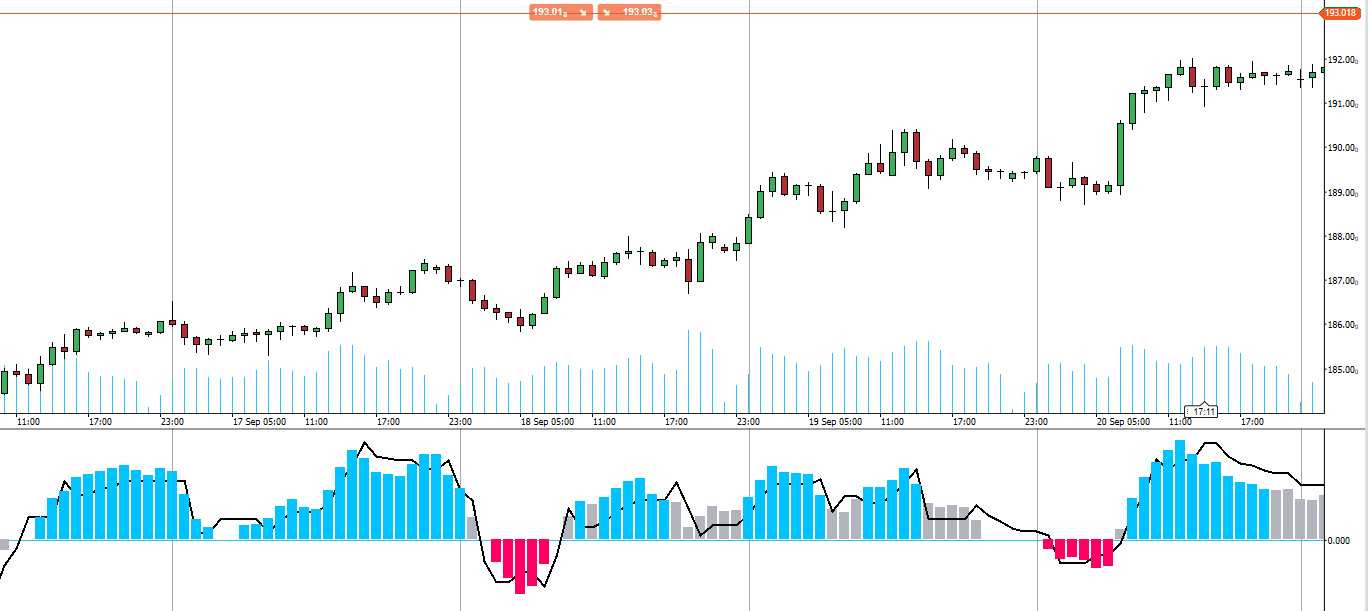
📊 Output Lines

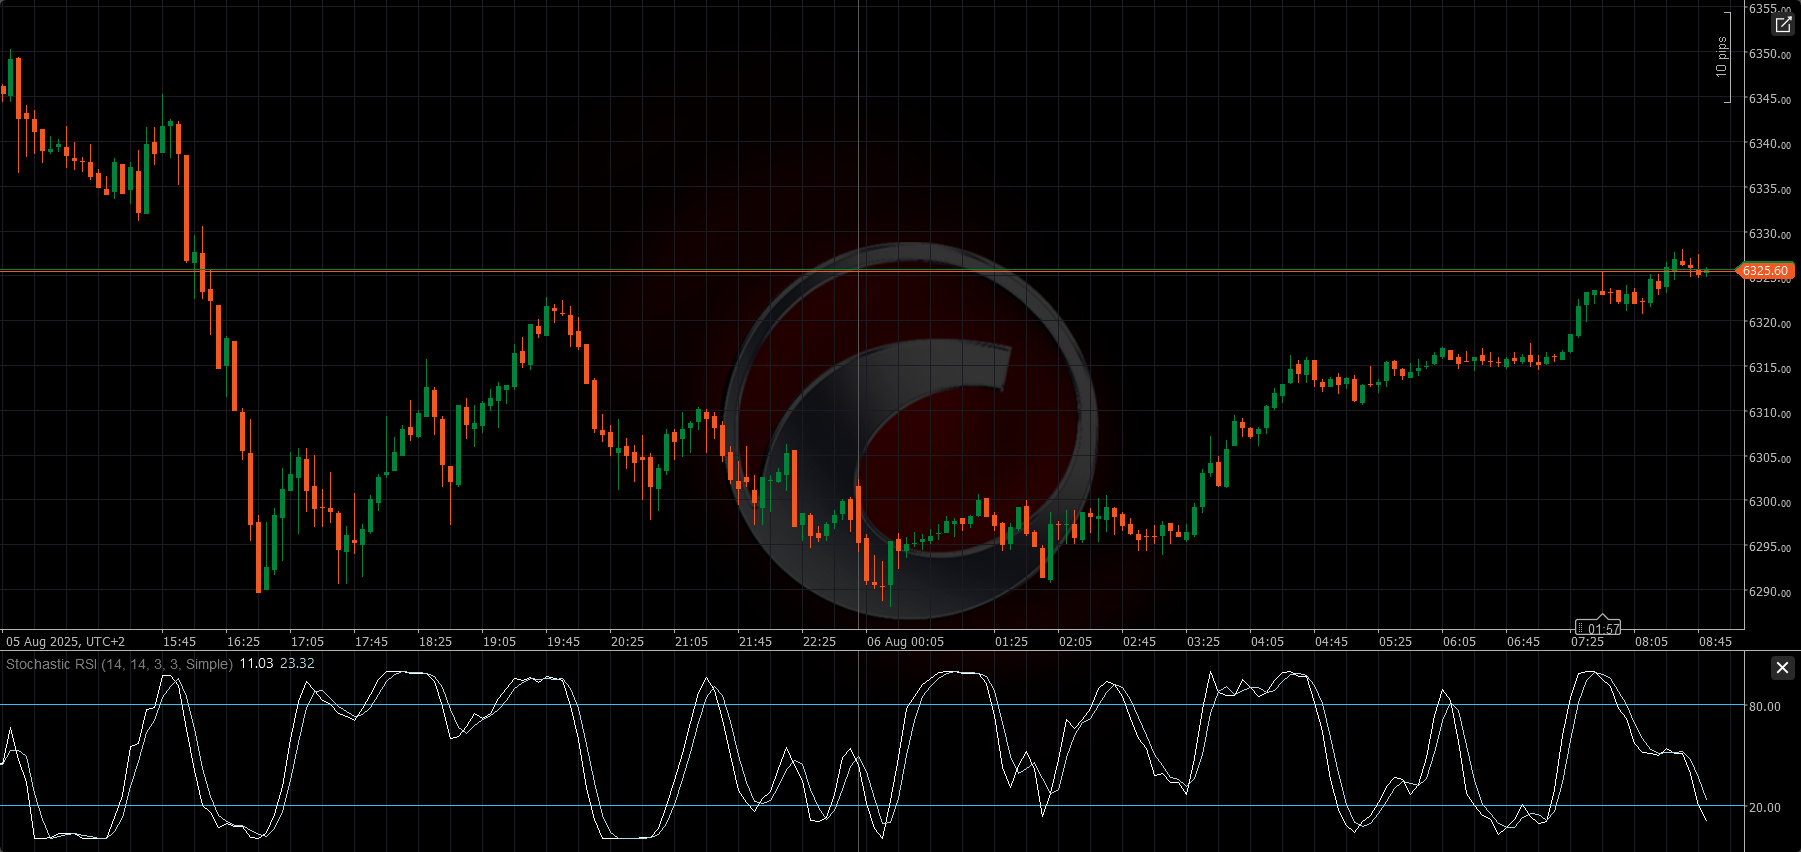
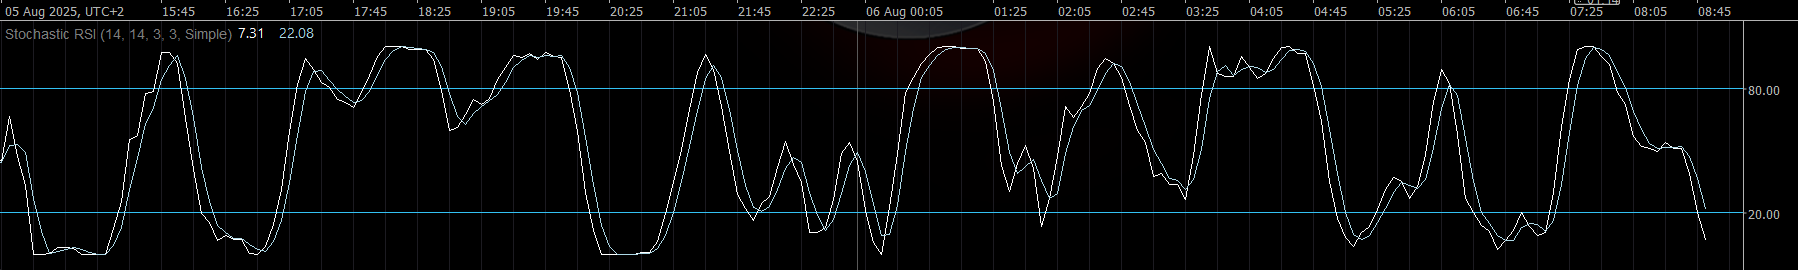
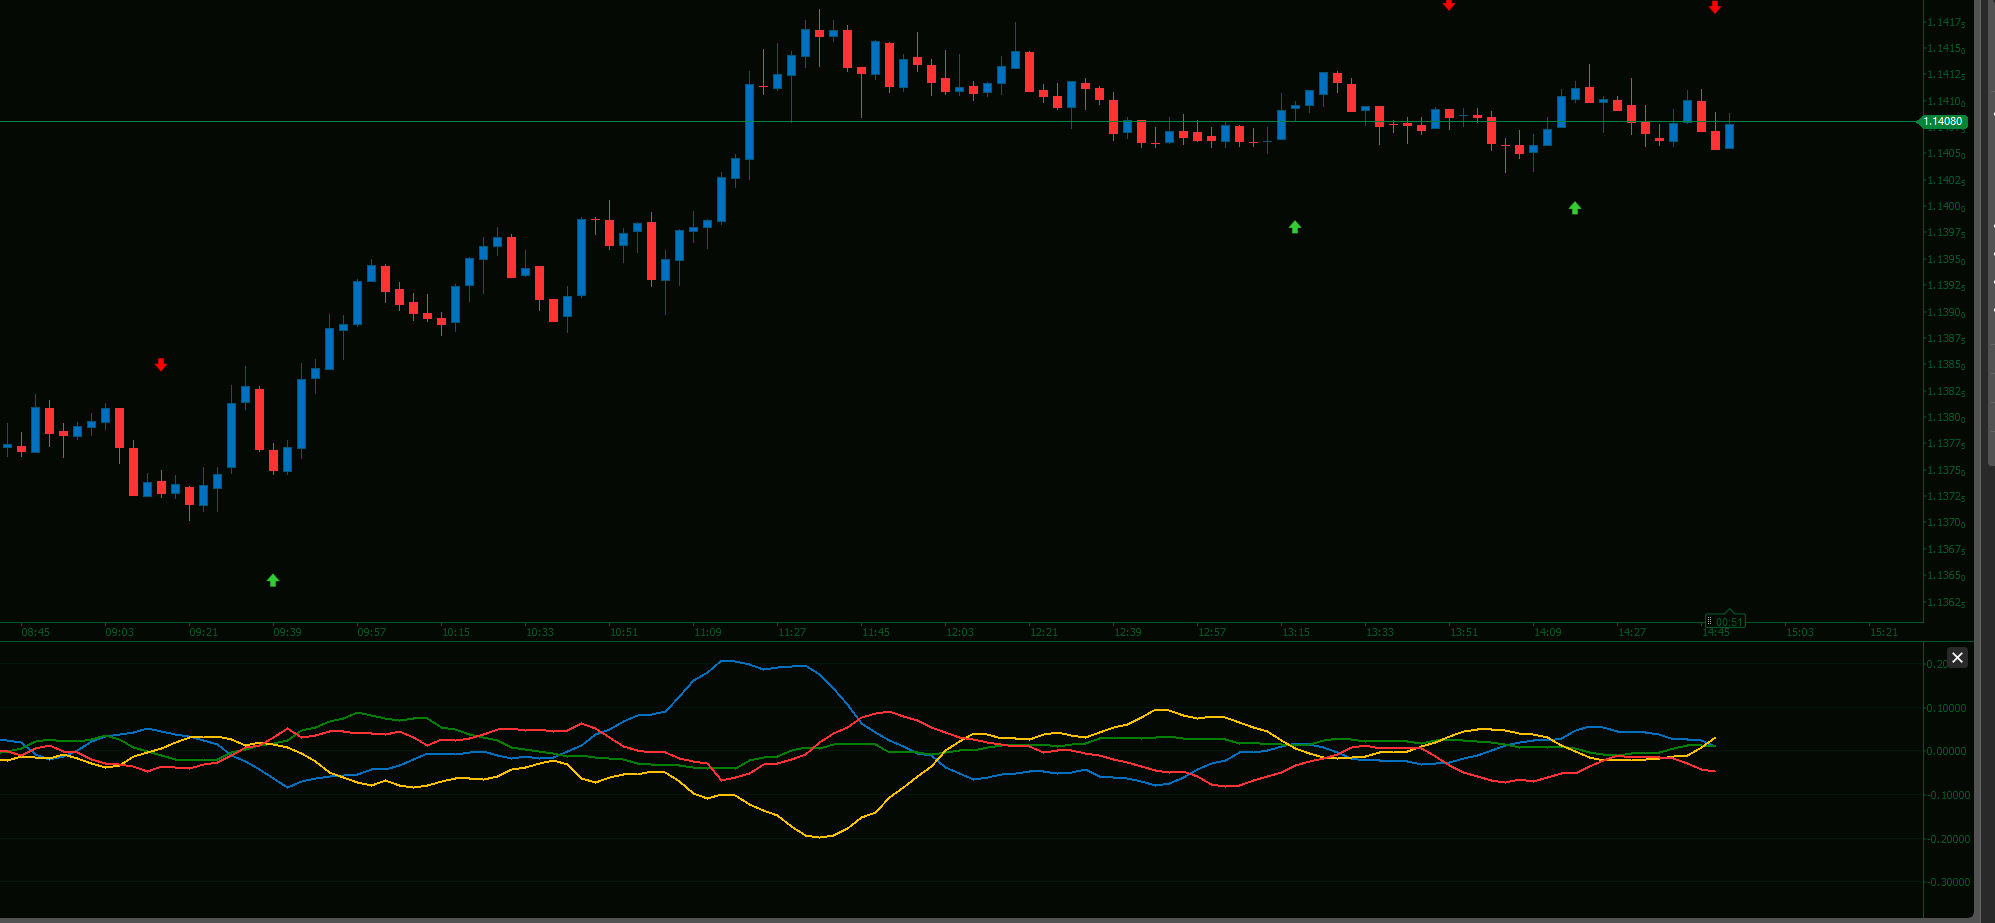
  • %K Line: Smoothed Stochastic RSI (white)
  • %D Line: Smoothed moving average of %K (lightblue)

Both lines oscillate between 0 and 100, allowing for clear overbought and oversold readings.
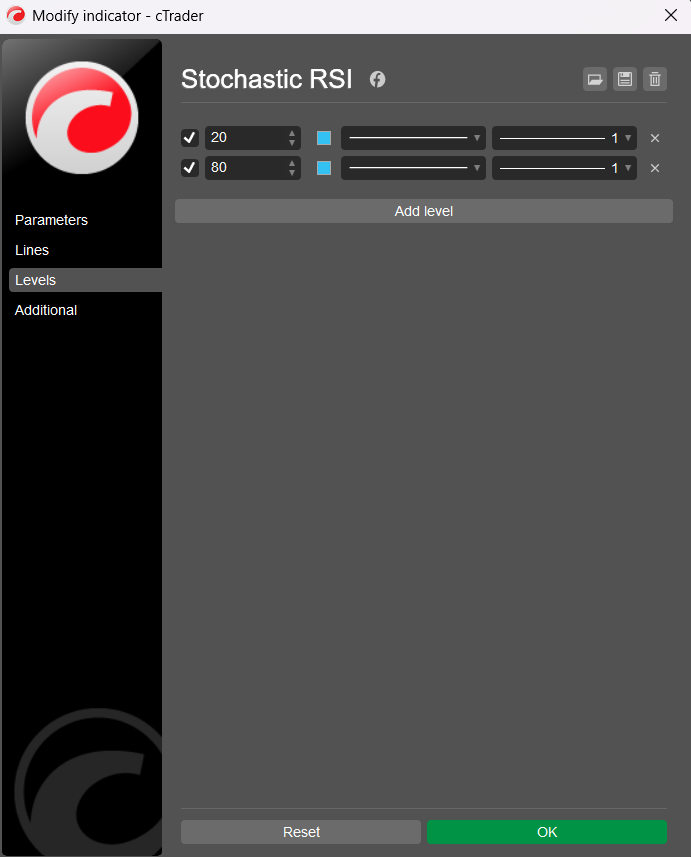
⚠️ Suggested Levels

Although the indicator does not display static levels by default, users are recommended to add these manually via the “Levels” tab in cTrader:

  • Level 80 → Overbought
  • Level 20 → Oversold

These levels work similarly to the traditional Stochastic Oscillator but applied to RSI behavior, making the signals sharper and often faster.

🧠 How to Use

  • Overbought (>80): May indicate price is overextended to the upside — potential for reversal or consolidation.
  • Oversold (<20): May signal price is oversold — possible bounce or trend reversal.
  • %K and %D Crossovers: Can be used similarly to Stochastic or MACD — a bullish crossover below 20 or bearish crossover above 80 may be actionable.
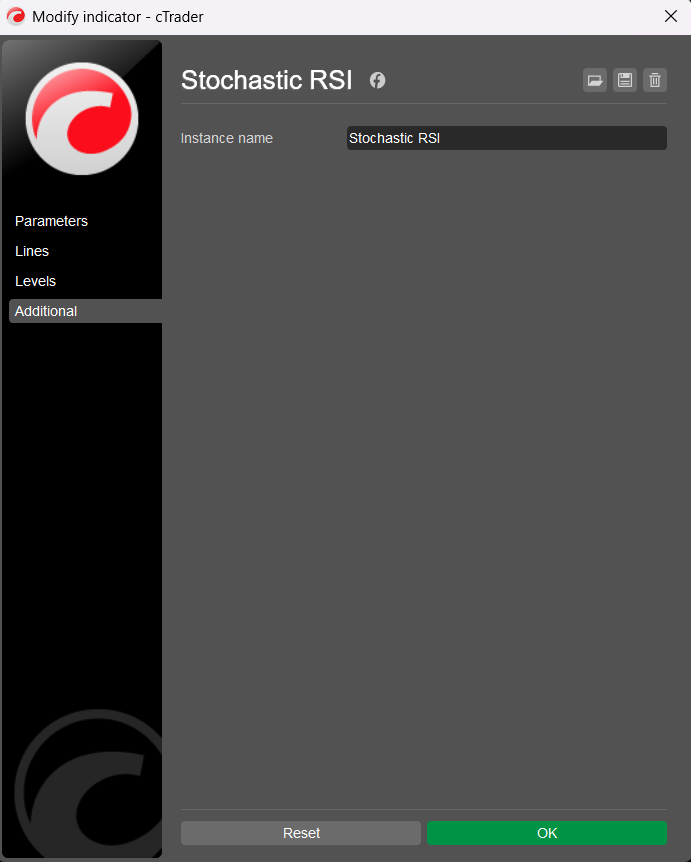
🏷️ Notes

  • Built for cTrader using C# and the Automate API
  • Clean, efficient, and customizable with 11 MA types
  • Code and logic by BlueRocketBots & ChatGPT (OpenAI)
  • Clean code (total 99 lines; 54 lines code, 27 lines text, 18 lines empty)
  • V2 improved version
  • For free!
You may also like
Supply Demand - BasicV1
Supply and demand zones. They're important. Here's a free version to get you started!
Indicator
forex
indices
commodities
+2
Advanced Swings
ICT Advanced Swings Indicator – Multi-Timeframe Precision
Cumulative Delta Candles + VolumeProfile
Cumulative delta candles + volume profile
Indicator
forex
signal
macd
swingh6
Swing-Trading Indicaotr for pairs like EUR/USD, AUD/USD, and USD/JPY. Most effective on higher time frames H4,H6,H12...
PriceLevels
Displays the previous day's, last week's, and last month's highest and lowest price levels on your chart.
Indicator
forex
usdjpy
signal
Yen Strength - Line Momentum
Single-line JPY Strength Indicator: Track yen momentum swiftly across key pairs—achieve clarity in your forex trades!
DMI CUSTOM SESSIONS
This will allow you to have SESSIONS on the chart. London, New York, Asian session and you can customize the times.
Indicator
signal
macd
TradingViewMACD
Enhance your trading strategy with our customizable TradingViewMACD indicator. Optimize and elevate your market analysis
EMA UP&DOWN 2025
SectorIndex Dual Moving Average Indicator: Your Market Compass 🧭
VegaXLR - RSI and StochRSI Alerts
VegaXLR's cTrader StochRSI identifies overbought/oversold RSI levels for precise trade entries.
ZigZagSmartAlert_demo
ZigZag Smart Alert DEMO for cTrader DEMO VERSION 24 hours free trial! This is a DEMO version of the ZigZag Smart Aler
Indicator
breakout
btcusd
supertrend
+5
Shielded Trend
Buy/Sell signals filtering noise, color-coded trends & strength shield 🛡️. Trade only with POWER ⚡
SwingHighLow
Auto-detect swing highs/lows. Spot reversals, map structure, and filter noise with adjustable strength.
Indicator
forex
indices
crypto
+1
Bullet Chart
✅ Unique Design. ✅ Works on All Time frames
Indicator
breakout
commodities
xauusd
CursorByte.SupportResistance v3
Draws support and resistance on all pairs.
Indicator
eurusd
rsi
macd
Supply&Demand
Precision Supply & Demand zones indicator—automatically plots key buy/sell areas on your chart for smarter entries.
Indicator
scalping
Grafico Diario
Bússola para Decisões de Trading Precisas e Eficientes!
Indicator
breakout
btcusd
supertrend
+5
Supertrend
💹 Define a price channel 📈 and determine trend direction (bullish 🟢 or bearish 🔴).