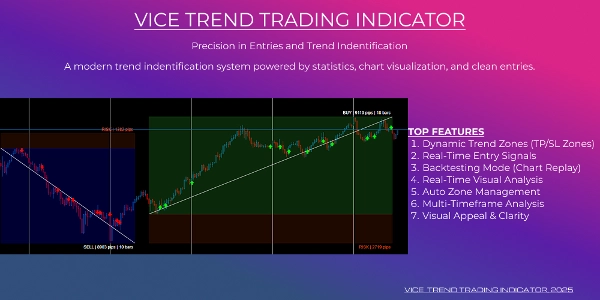
Vice TrendTrading
"Vice TrendTrading" logo
19/07/2025
Desktop
Sinceย 17/06/2025
"Vice TrendTrading" uploaded image"Vice TrendTrading" uploaded image"Vice TrendTrading" uploaded image"Vice TrendTrading" uploaded image

Vice TrendTrading
"Advanced Trend Zones & Precision Entry Arrows Powered by Multi Timeframe Trend Logic"

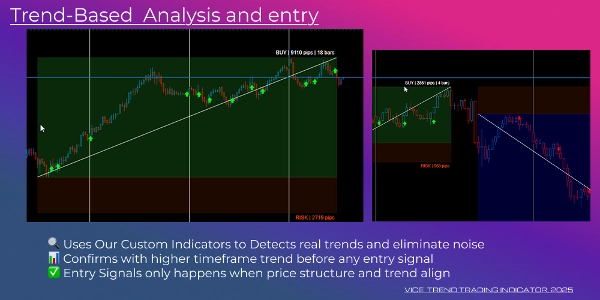
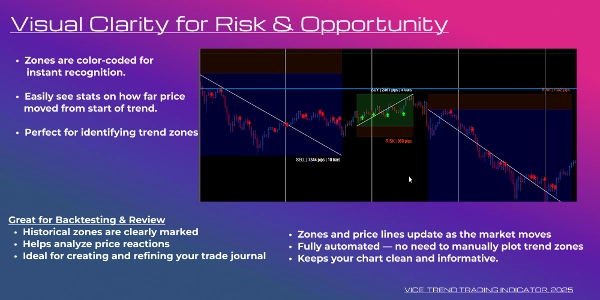
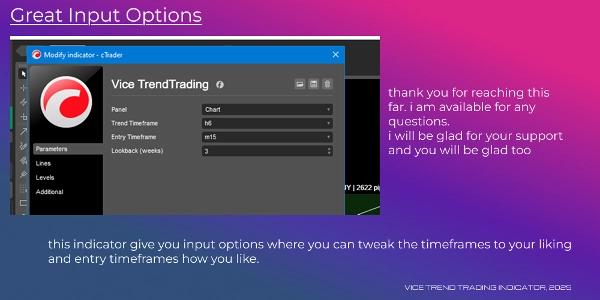
This is not just another trend indicator โ€” it's a complete visual trading system designed to help you find market trend, track market performance in real time, and analyze trend results with clarity.

This advanced tool combines multi-timeframe trend analysis, real-time profit/loss overlays, and automatic signal arrows into one clean and powerful chart experience.

Key Features:

1. Dynamic Trend Zones (TP/SL Visuals)

0.0
Reviews: 0
Customer reviews
No reviews for this product yet. Already tried it? Be the first to tell others!
You may also like
Indicator
Indices
RSI
Bollinger
Clustering
Clustering tool for traders with visual insights into market patterns.
ICT Killzone and Sessions high_low
This indicator is an essential tool for traders seeking to visualize key trading sessions on their charts.
Indicator
Grid
NAS100
NZDUSD
+13
Standard Deviation Channel
Visualize trends with Standard Deviation Channel! Display median, and add customizable upper/lower deviation channels.
Indicator
NAS100
NZDUSD
Martingale
+24
LookPosOrderIndicator
On-chart draggable panel to show/hide Positions & Pending Orders with fixed warning banner and inline alerts per symbol.
Zero Lag Exponential Moving Average
ZLEMA (Zero Lag EMA) is a faster, smoother version of EMA, ideal for capturing quick market shifts and trends.
Indicator
RSI
XAUUSD
Breakout
+4
S&R Structural ZigZag
"Detects swings ๐ŸŽฏ, draws zigzag trends ๐Ÿ“ˆ๐Ÿ“‰, support/resistance โน๏ธ, labels HH/HL/LH/LL, Tracks market structure ๐Ÿš€๐Ÿป."
CRT Pattern Indicator
The CRT indicator helps ICT traders identify candlestick patterns, enhancing analysis of higher timeframe on lower
Indicator
RSI
Breakout
Supertrend
+1
Reactive Moving Average
Combines SMA with dynamic correlation to adapt to market trends. Adjusts sensitivity, filters noise๐Ÿš€๐Ÿ“‰
Indicator
Indices
Prop
Commodities
+3
OBScope
A cutting-edge indicator designed to detect and visualize high-probability zones based on swing highs, swing lows.
Indicator
NAS100
XAUUSD
Commodities
+11
WHT AIRRA
Indicator that auto-calculates SL/TP via volatility. 3 layers: digital filtering, recursive Bayes, adaptive factor
Indicator
Signal
MeetAlgo_ChannelTrading_cTrader
Channel Trading is a volatility-based indicator using envelope theory to spot price breakouts and trade signals.
Indicator
Grid
NAS100
NZDUSD
+15
TS_Pivot
Those who are involved in trading know how important it is to take into account the previous session. With Order Block
Indicator
Indices
Breakout
Stocks
+2
VegaXLR - cTrader Pitchfork & Channel Enhancer
Enhance Pitchfork & Price Channels in cTrader with customizable Equidistant and Fibonacci levels.
Break of Structure
The Break of Structure (BoSCHoCh) Indicator is a smart market structure tool designed to help traders easily spot trend.
FVG
The Indicator is a powerful tool for price-action traders seeking to identify and exploit short-term imbalances.
Larry Williams 9.1
Larry Williams 9.1
IR Candle Open
IR Candle Open plots customizable opening price lines for daily, weekly, and monthly candles