Indicator
scalping
"ACTO-v1" logo
ACTO-v1
0.0
03/09/2025
0
Desktop
"ACTO-v1" uploaded image

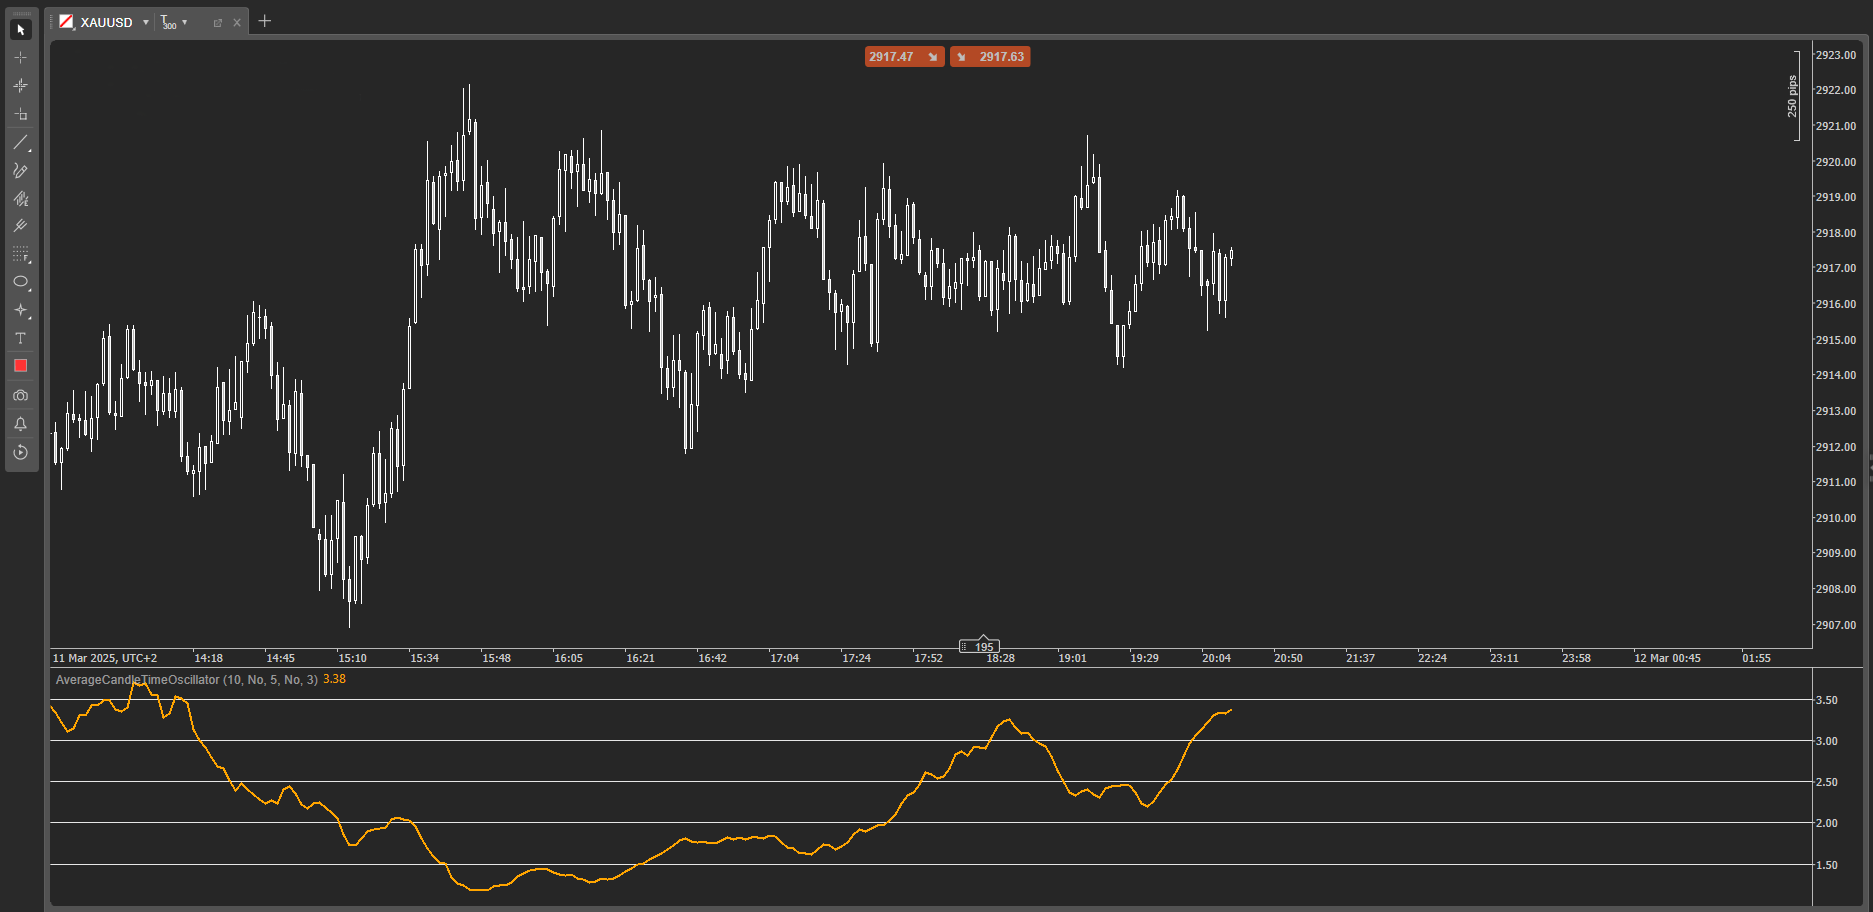
Average Candle Time Oscillator (ACTO)

Enhance your trading performance with ACTO, the advanced oscillator that analyzes the average duration of chart candles, enabling you to quickly identify volatility and market activity changes.

Why choose ACTO?

  • Accurate Candle Time Measurement: Easily detect slow or rapid market conditions to optimize your entries and exits.
  • Customizable Threshold: Set specific thresholds to highlight critical moments and promptly react to shifts in market rhythm.
  • Automatic Alerts: Receive immediate notifications when the average candle duration exceeds your set threshold, ensuring you never miss important trading opportunities.
  • User-Friendly Interface: Simple and intuitive display, suitable for traders of all skill levels.

Perfect for scalping, day trading, and short-term timeframe trading, ACTO is an essential tool for any trader looking to anticipate significant market movements based on market timing dynamics.

Other indicators

More from this author
Indicator
forex
crypto
stocks
Quantum Weighted Moving Average (QWMA)
Quantum Weighted Moving Average (QWMA): an advanced moving average that dynamically adjusts weights to market movement
You may also like
Indicator
eurusd
Compare Symbol
Plots chosen symbol's close price, candlestick (wick, body) on cTrader chart, supports multiple timeframes.
RT TradingView ATR
Upgrade to ATR-RMA! Experience the precise ATR using Relative Moving Average for accurate volatility analysis in cTrader
Indicator
forex
indices
gbpusd
+2
HorizontalSupportResistance
This extraordinary multi-timeframe support and resistance indicator is nothing short of market wizardry.
Cumulative Delta Candles + VolumeProfile
Cumulative delta candles + volume profile
trPDHLC
this indicator shows previous day high low and closed with precise manner.
Supertrend Indicator v1.1
SUPERTREND INDICATOR v1.1
Trinity StochX
Indicator Stochastic With RSI
Indicator
breakout
PDHL
PDHL - Previous Day High&Low
SupertrendChannels
Supertrend-based channel for entries, trailing stops, and dynamic support/resistance zones.
Indicator
signal
IM_AngleIndicator
Indicator that calculates the slope of a moving average (SMA) and displays the value of the slope in degrees
Indicator
breakout
indices
supertrend
[CB] Pivot Points Pro
You can use the cTrader Pivot Points Pro indicator to find a good pullback entry in a trend
VegaXLR - cTrader Chart Themes
Free chart themes for the cTrader platform.
RSI T3 Overbought and oversold areas
Three parameter RSI
Indicator
forex
eurusd
xauusd
+3
Daily Open Color Zones
indicator showing the Daily Open Line and instantly shading bullish and bearish zones.
Indicator
forex
indices
crypto
+1
Bullet Chart Trend
Unique Pyramid Design , Clear Price Action Trend
BarCount
Bar count
Indicator
forex
prop
usdjpy
JPY Samurai Breakout Lite
⚔️ JPY Samurai Breakout Lite — Simple Breakout Indicator for cTrader ⚔️
Top-rated
High TF Plotter
Captra High TF Plotter visualizes high timeframe Bar on lower timeframe charts, highlighting with bull/bear colors.