"Quantum Weighted Moving Average (QWMA)" logo
Quantum Weighted Moving Average (QWMA)
"Quantum Weighted Moving Average (QWMA)" uploaded image
249.58M
Traded volume
1.65M
Pips won

Quantum Weighted Moving Average (QWMA)

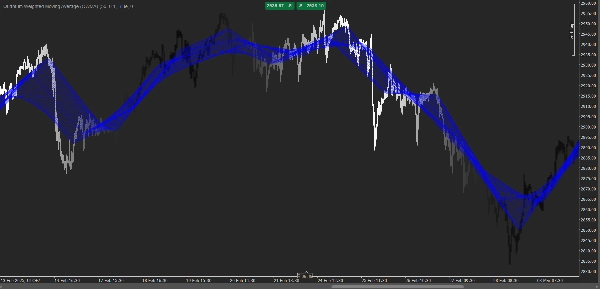
The Quantum Weighted Moving Average (QWMA) is an advanced trading indicator designed to dynamically adjust the weighting of past prices based on market conditions. Unlike traditional moving averages that apply fixed weights, QWMA uses an adaptive exponential decay function to assign greater importance to recent price movements while still considering historical data.

Key Features:

Adaptive Weighting: Adjusts the influence of past prices based on volatility and trend strength.
Enhanced Sensitivity: Reacts faster to price changes compared to simple and exponential moving averages.
Noise Reduction: Helps filter out market noise while preserving trend clarity.
Customizable Parameters: Allows traders to modify decay factors and weighting functions to suit different trading strategies.

How It Works:

QWMA applies an exponential decay function to past price data, ensuring that older prices have diminishing influence while recent values contribute more significantly. This results in a smoother yet more responsive trend line that adapts to shifting market dynamics.

Ideal For:

📈 Trend Followers – Identify strong trends with minimal lag.
📉 Swing Traders – Detect market reversals earlier than standard moving averages.
💹 Scalpers – Gain quick insights into short-term momentum shifts.

QWMA is a powerful tool for traders seeking a balance between smoothness and responsiveness, making it suitable for various financial markets, including stocks, forex, and crypto trading. 🚀

Indicator profile
0.0
Reviews: 0
Customer reviews
No reviews for this product yet. Already tried it? Be the first to tell others!
Forex
Crypto
Stocks
Products available through cTrader Store, including trading bots, indicators and plugins, are provided by third-party developers and made available for informational and technical access purposes only. cTrader Store is not a broker and does not provide investment advice, personal recommendations or any guarantee of future performance.

More from this author

ACTO: Oscillator tracking average candle duration to anticipate volatility shifts in trading.

You may also like

This indicator is a valuable tool for traders looking to identify significant opening price level of any asset.
Track major trading sessions (Tokyo, London, New York) with customizable colors and visual sessions on your chart.
Professional position management! Calculate real-time pivots, monitor P&L & costs, and strengthen your strategy.
Marks Monday's OPEN,HIGH & LOW. These are areas of support and resistance for the week.
Stochastic Confluence Pro (RSI + Divergence)
cTreder Smart SMA
Multi-symbol Inside Bar Scanner with dashboard & breakout alerts
CAUTION! THIS TOOL IS FOR PRO'S ONLY
Three ZigZag lines
Stochastic RSI Indicator
Candle Timer & Strength Panel DEMO for cTrader DEMO VERSION – 24 hours free trial! This is a DEMO version of the Candle
Professional VWAP + Sigma Bands. Auto signals, 3 modes, live stats, multi-level entry/exit. Proven volume-based system.
Multi Timeframe Candle drawing. Draw Any candles from any timeframe on your chart :-)
ICT Breakers (BOS/MSS) - Professional market structure and breakout detection tool.
Buy at green arrow if trend is bullish and viceversa
GUPPY TREND MASTER V3.. Visualize Market Sentiment with the 38-EMA Rainbow The Guppy Trend Master 4X4 Indicator
LevelMaster S/R: Pinpoint key support & resistance zones with precision. Perfect for traders of all levels Trade smarter
The Candle Pressure Index is a powerful, user-friendly indicator that reveals hidden market pressure inside candles.
249.58M
Traded volume
1.65M
Pips won