
ACTO-v1
Indicator
Version 1.0, Mar 2025
Windows, Mac
4.5
Reviews: 2
Description
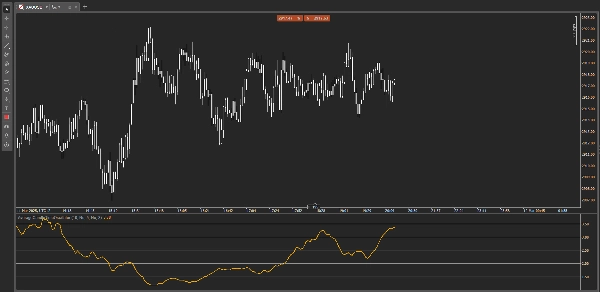
Average Candle Time Oscillator (ACTO)
Enhance your trading performance with ACTO, the advanced oscillator that analyzes the average duration of chart candles, enabling you to quickly identify volatility and market activity changes.
Why choose ACTO?
- Accurate Candle Time Measurement: Easily detect slow or rapid market conditions to optimize your entries and exits.
- Customizable Threshold: Set specific thresholds to highlight critical moments and promptly react to shifts in market rhythm.
- Automatic Alerts: Receive immediate notifications when the average candle duration exceeds your set threshold, ensuring you never miss important trading opportunities.
- User-Friendly Interface: Simple and intuitive display, suitable for traders of all skill levels.
Perfect for scalping, day trading, and short-term timeframe trading, ACTO is an essential tool for any trader looking to anticipate significant market movements based on market timing dynamics.
Other indicators
Summary
Indicator profile
Customer reviews
4.5
Reviews: 2
5 | 50 % | |
4 | 50 % | |
3 | 0 % | |
2 | 0 % | |
1 | 0 % |
Customer reviews
March 19, 2025
The product earns time when it gives the trader a reason to pause. Demo first makes more sense.
March 15, 2025
Bad impulses show up less often in the notes, but the market context still matters.
Discussion
FAQ
Scalping
Products available through cTrader Store, including trading bots, indicators and plugins, are provided by third-party developers and made available for informational and technical access purposes only. cTrader Store is not a broker and does not provide investment advice, personal recommendations or any guarantee of future performance.
More from this author


!["[CB] Pivot Points Pro" logo](https://cdn.ctrader.com/image/webp/43463c82-67b0-4f10-a4ba-901bba091d81_32594)


Price
378.94M
Traded volume
1.9M
Pips won