"RT TradingView ATR" logo
RT TradingView ATR
0.0
03/09/2025
1
Desktop
"RT TradingView ATR" uploaded image

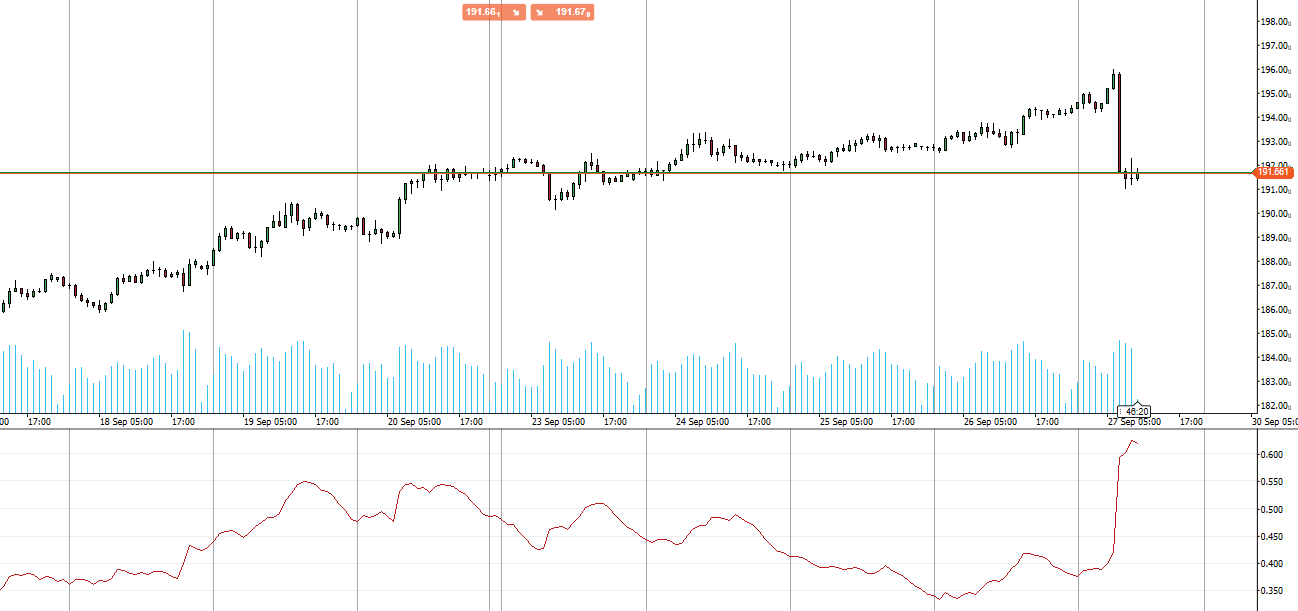
Introducing the TradingView ATR indicator for cTrader, designed to match the precision of TradingView’s Average True Range calculation.

This enhanced ATR uses a Relative Moving Average (RMA) for its calculations, providing a more accurate reflection of market volatility compared to the default ATR in cTrader. By incorporating the RMA, this indicator offers smoother and more responsive volatility readings, helping you make better-informed trading decisions.

Perfect for traders seeking improved accuracy in their technical analysis, this ATR indicator is a powerful tool to elevate your trading strategy.

Upgrade your cTrader toolkit with this ATR indicator for precise and reliable volatility insights.

More from this author
RT MACD
Customize the MACD! Choose colors, get real-time tick updates, and see crossover points for enhanced trading precision.
RT VWAP
Unlock VWAP in cTrader! Choose anchor periods, price sources, and display deviation bands with real-time tick updates.
RT Chandelier Exit
Optimize exits with Chandelier Exit! Visualize stop-loss points dynamically for improved trading precision and safety.
Indicator
breakout
atr
RT ATR Bands
Enhance trading with ATR Bands! Visualize market volatility using dynamic upper and lower ATR bands for precise decision
Indicator
indices
RT True Strength Index
Enhance trading with TSI! Use the True Strength Index for clear insights into market momentum and trend strength.
Indicator
bollinger
RT Qualitative Quantity Estimation
Unlock trading precision with QQE! Dual QQE indicators with a Bollinger Bands zero line provide clear buy/sell signals.
Indicator
breakout
RT Consolidation Zones
Identify and trade breakouts with Consolidation Zones! Visualize price consolidation areas for trading opportunities.
RT Stochastic RSI PRO
Unlock Stochastic RSI PRO in cTrader! Overlay RSI, highlight zones, and identify divergences with customizable settings.
Indicator
breakout
RT Standard Deviation Channel_noSourceCode
Visualize trends with Standard Deviation Channel! Display median, and add customizable upper/lower deviation channels.
RT Moving Average PRO v1.1
Customize your Moving Average! Choose any timeframe and price source for precision and flexibility in your analysis.
RT MACD Histogram
Enhance MACD Histogram! Visualize bull and bear price changes with vibrant colors for clearer, more insightful trading.
RT Relative Moving Average
Bring the RMA to cTrader! This is the Relative Moving Average from TradingView.
Indicator
breakout
bollinger
RT Bollinger Bands Cloud
Visualize Bollinger Bands with a colored cloud for clarity. Enhance your trading precision with this dynamic indicator!
RT Time Segmented Volume
Enhance trading with TSV! Analyze volume flow and price trends using the powerful Time Segmented Volume indicator.
You may also like
Indicator
bollinger
commodities
rsi
+1
Dot Momentum %BB Indicator
Dynamic circles visualize price's volatility position. Like RSI for market overextension & stretch. Quantify context.
DOMFlowScalperPRO
Scalp smarter with DOM Flow Scalper PRO – real-time Bid/Ask imbalance and volume precision!
IR Ichimoku Macd
this indicaotr show distance between Tenkan to Kijun, Close to Kijun and Close to Tenkan 
Weekly Daily Levels
The Weekly Daily Levels indicator shows the OHLC, and mid-point prices for the previous day and week.
HeatMap Candle
HeatMap Candle
Anchored VWAP Buttons
Indicator
breakout
btcusd
supertrend
+4
ZScore Reversion
Z-Score: Measures price deviations from its mean. Spots overbought/sold (±2-3 SD) & reversals. Key for stats trading
FiboTrend-Pro V2
New version of one of my favorites includes Fibonacci and moving average convergence divergence lines
Indicator
bollinger
indices
rsi
+1
[Stellar Strategies] QQE
The QQE indicator is a technical analysis tool designed to identify potential trend changes and trading signals 📈📉
SmartBot-MCDX Indicator
MCDX is a powerful and innovative indicator.
SmartArrows AI V2
High-Performance Renko Chart Indicator with Advanced AI Filtering.
Indicatore utbot
L'indicatore UTBot è uno strumento di analisi tecnica che crea una linea di trailing stop dinamica basata sull'ATRT
IR Moving MTF
multi time frame moving averge. you could choose different type of price like median ,high and ... and differnt type of
Ctreder Smart SMA Indicator
cTreder Smart SMA
Indicator
forex
commodities
scalping
+1
Support & Resistance Pro
The Support & Resistance Pro helps traders identify key support and resistance levels for informed trading decisions.
Chaikin Money Flow
Chaikin money flow's primary purpose is to distinguish between periods of accumulation and distribution of a security.
Indicator
forex
indices
gbpusd
+2
HorizontalSupportResistance
This extraordinary multi-timeframe support and resistance indicator is nothing short of market wizardry.
[Hamster-Coder] Pivot Points
[Hamster-Coder] Pivot Points (Standard)