RT Time Segmented Volume
Indicator
Version 1.0, Sep 2024
Windows, Mac
Description
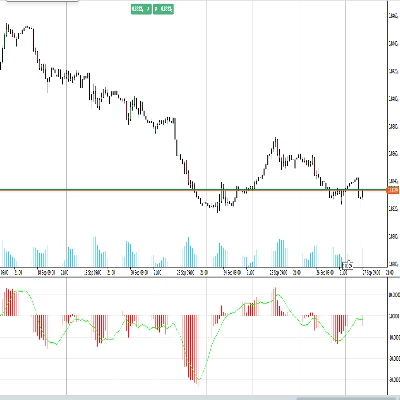
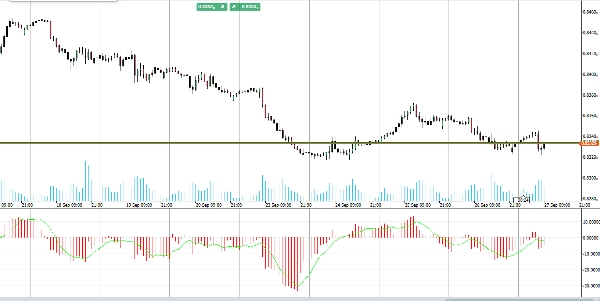
Introducing the Time Segmented Volume (TSV) indicator, designed to enhance your trading strategy with deeper insights into volume flow and price trends.
The TSV indicator measures the relationship between price and volume over a specified time period, helping you identify accumulation and distribution phases in the market.
Identify used to identify trends in stock prices, pinpoint support and resistance levels, and decode trading signals.
Perfect for traders seeking to refine their analysis and improve their decision-making, the TSV indicator offers a powerful tool for understanding market dynamics.
Upgrade your trading toolkit with the Time Segmented Volume indicator for superior trading performance.
Summary
Indicator profile
Customer reviews
0.0
Reviews: 0
Customer reviews
No reviews for this product yet. Already tried it? Be the first to tell others!
Discussion
FAQ
BTCUSD
Forex
Indices
EURUSD
Commodities
GBPUSD
NZDUSD
Prop
Crypto
Stocks
XAUUSD
NAS100
USDJPY
Products available through cTrader Store, including trading bots, indicators and plugins, are provided by third-party developers and made available for informational and technical access purposes only. cTrader Store is not a broker and does not provide investment advice, personal recommendations or any guarantee of future performance.


Price
Since 25/09/2024
20
Sales