
WaveWeisBarForce
Indicador
169 descargas
Versión 1.0, Dec 2025
Windows, Mac
5.0
Valoraciones: 2
Descripción
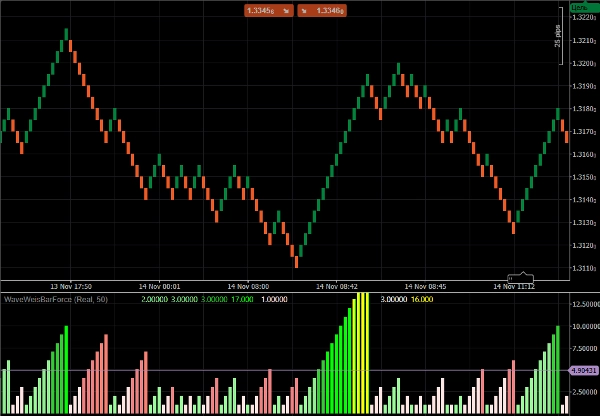
Wave Weis Bar Force - es un indicador que aplica la lógica de las ondas de volumen (Weis) para determinar la acumulación y los cambios en la dirección del mercado.
Resume el volumen mientras la tendencia permanece sin cambios. Cuando la dirección cambia, comienza una nueva onda y la acumulación se reinicia.
La intensidad se calcula por niveles, según la relación entre el volumen de la onda actual y la mayor acumulación reciente. Sirve como un filtro adicional y se muestra bien en estrategias de tendencia.
Resumen
Resumen de IA
Wave Weis Bar Force is a technical indicator that applies the concept of Volume Waves (Weis) to identify market accumulation phases and detect changes in market direction. It aggregates volume data while the current trend persists, resetting accumulation when a new wave begins with a trend reversal. The indicator calculates intensity levels based on the ratio of the current wave's volume to the largest recent accumulation, providing a quantitative measure of volume strength. This functionality serves as an additional filter and is particularly useful in trending market strategies. The indicator supports analysis across multiple markets including Forex, Crypto, and Stocks, and is applicable to trading approaches such as breakout and scalping strategies.
Perfil del indicador
Valoraciones de clientes
5.0
Valoraciones: 2
5 | 100 % | |
4 | 0 % | |
3 | 0 % | |
2 | 0 % | |
1 | 0 % |
Valoraciones de clientes
December 10, 2025
WaveWeisBarForce blends Weis Wave logic with bar-strength analysis to show real buying/selling force. Clean histogram, stable performance, great for confirming impulses and spotting exhaustion. Useful for Wyckoff, VSA and intraday momentum traders.
Conversación
Preguntas frecuentes
Forex
Breakout
Scalping
Crypto
Stocks
Los productos disponibles a través de cTrader Store, incluidos bots, indicadores y plugins para operar, son proporcionados por desarrolladores de terceros y están disponibles únicamente con fines informativos y de acceso técnico. cTrader Store no es un bróker, por lo que no proporciona asesoramiento de inversión, recomendaciones personales ni ninguna garantía de rentabilidad futura.
Más de este autor


![Logotipo de "[Stellar Strategies] Inside Bar with Signals"](https://cdn.ctrader.com/image/webp/1d9e8bfa-3b2c-4440-bb37-5856902008a7_30683)


Precio
Desde 24/10/2025
1.43M
Volumen operado
4.79K
Pips ganados
2
Ventas
317
Instalaciones gratis