Descripción
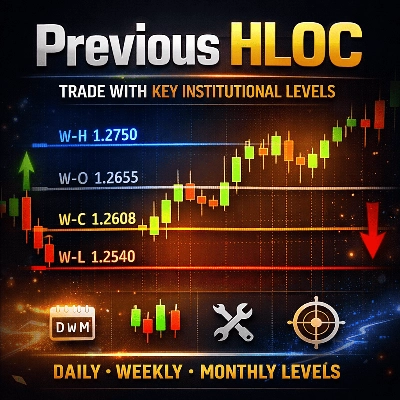
Previous HLOC – Niveles Inteligentes de Marcos Temporales Superiores para un Comercio Preciso
Previous HLOC es un indicador profesional multitemporal que traza los niveles de Alto, Bajo, Apertura y Cierre del período anterior directamente en tu gráfico con una claridad y personalización inigualables.
Diseñado para traders de acción del precio, scalpers, traders intradía y traders de swing, este indicador te ayuda a identificar instantáneamente niveles institucionales clave que a menudo actúan como soportes, resistencias, zonas de rechazo y objetivos de liquidez.
¿Por qué Previous HLOC?
Los mercados reaccionan consistentemente a niveles del día, semana y mes anteriores. Las instituciones, algoritmos y traders profesionales siguen estos niveles de cerca.
Previous HLOC lleva esos precios críticos a tu gráfico de manera limpia y sin distracciones, para que nunca los pierdas.
Características Clave
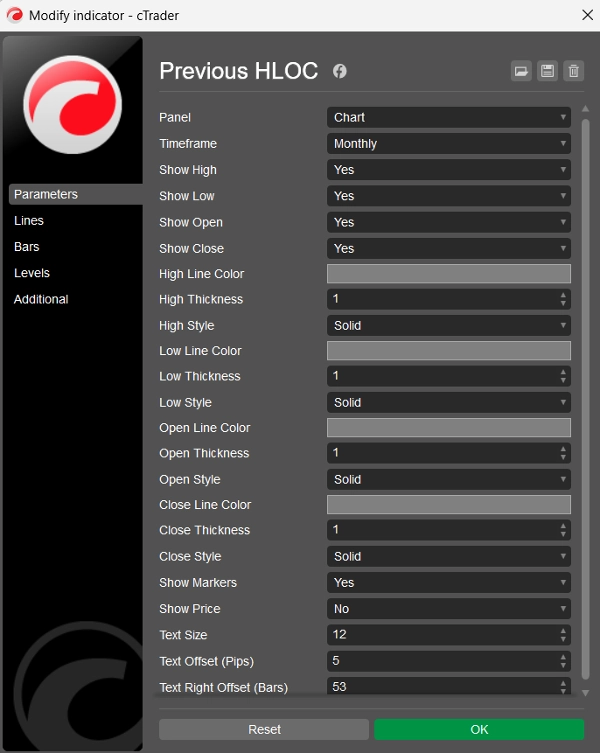
✅ Niveles Multitemporales
- Elige niveles de vela Diarios, Semanales, Mensuales o Horarios
- Los niveles permanecen precisos sin importar el marco temporal de tu gráfico
✅ Control Completo de HLOC
- Activa o desactiva Alto, Bajo, Apertura, Cierre individualmente
- Opera solo con lo que importa para tu estrategia
✅ Personalización Avanzada
- Separa color, grosor y estilo de línea para cada nivel
- Marcadores limpios con fuente Consolas y tamaño de texto ajustable
- Visualización opcional del precio junto a cada marcador
✅ Marcadores Flotantes Inteligentes
- Los marcadores se mueven naturalmente con el gráfico
- Siempre permanecen alineados con el nivel de precio al desplazarse
- Posicionados en el lado derecho para una visibilidad clara
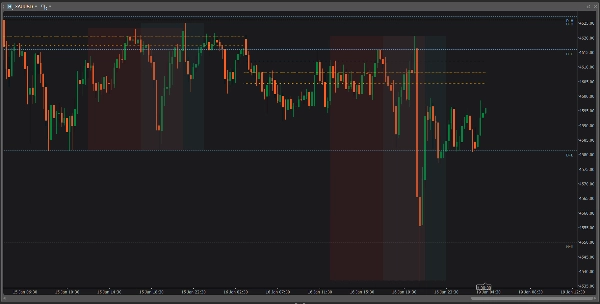
✅ Niveles Proyectados a Futuro
- Las líneas se extienden hacia el futuro
- Ideal para planificar entradas, salidas, stop-loss y niveles de take-profit
🔹 Cómo lo Usan los Traders
📌 Identifica soportes y resistencias intradía fuertes
📌 Usa el Alto/Bajo anterior como zonas de barrido de liquidez
📌 Opera rupturas, rechazos y retests
📌 Alinea las entradas con la tendencia de marcos temporales superiores
📌 Mejora la precisión riesgo-recompensa
🔹 ¿Para Quién es Este Indicador?
✔ Traders de Forex
✔ Traders de índices y commodities
✔ Scalpers y traders diarios
✔ Traders de swing
✔ Traders de acción del precio y SMC
🔹 Limpio. Rápido. Fiable.
- Sin repintado
- Sin retrasos
- Sin desorden
- Funciona en todos los símbolos y todos los marcos temporales
🔹 Resumen
Previous HLOC no es solo otro indicador de niveles—es una herramienta profesional de trading que te ayuda a operar con contexto, estructura y confianza.
Si operas alrededor de niveles de sesiones anteriores, este indicador debe estar en tu gráfico.
Resumen
Valoraciones de clientes
5 | 100 % | |
4 | 0 % | |
3 | 0 % | |
2 | 0 % | |
1 | 0 % |


