
คำอธิบาย
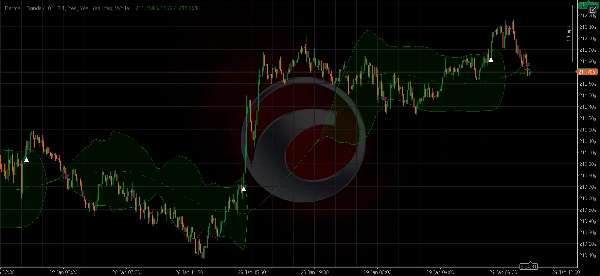
Bermaui Bands (BB) เป็นเครื่องมือวิเคราะห์ทางเทคนิคที่ช่วยกรองระหว่างการเคลื่อนไหวของราคาที่มีช่วงแคบและแนวโน้ม แนวคิดเบื้องหลังตัวบ่งชี้นี้สามารถอธิบายได้ในขั้นตอนถัดไป -
- คำนวณส่วนเบี่ยงเบนมาตรฐานเป็นออสซิลเลเตอร์ที่เคลื่อนที่ระหว่าง 0 ถึง 100 จะเรียกมันว่าเปอร์เซ็นต์เบี่ยงเบน Bermaui (BD percent)
- ถ้า "BD percent" ใกล้ศูนย์ แสดงว่าความผันผวนอยู่ในระดับสูงสุด นอกจากนี้ถ้า "BD percent" ใกล้ 100 แสดงว่าความผันผวนต่ำมาก
- ความผันผวนสูงหมายถึงความน่าจะเป็นสูงสำหรับตลาดที่มีแนวโน้ม ในขณะที่ความผันผวนต่ำหมายถึงตลาดที่เคลื่อนไหวแบบด้านข้างหรือช่วงแคบ
- เส้นกลางคือค่าเฉลี่ยเคลื่อนที่แบบง่ายเพราะส่วนเบี่ยงเบนมาตรฐานถูกคำนวณขึ้นอยู่กับค่าเฉลี่ยเคลื่อนที่
- เพิ่ม "BD percent" ไปยังค่าเฉลี่ยเคลื่อนที่แบบง่ายที่มีจำนวนแท่งเท่ากันในการคำนวณเพื่อให้ได้ Upper Bermaui Band
- ลบ "BD percent" ออกจากค่าเฉลี่ยเคลื่อนที่แบบง่ายที่มีจำนวนแท่งเท่ากันในการคำนวณเพื่อให้ได้ Lower Bermaui Bands
สรุป
โปรไฟล์อินดิเคเตอร์
รีวิวจากลูกค้า
0.0
รีวิว: 0
รีวิวจากลูกค้า
ยังไม่มีรีวิวสำหรับผลิตภัณฑ์นี้ หากเคยลองแล้ว ขอเชิญมาเป็นคนแรกที่บอกคนอื่น!
การสนทนา
คำถามที่พบบ่อย
Forex
Signal
Breakout
Indices
Commodities
Crypto
Stocks
ผลิตภัณฑ์ที่มีให้บริการผ่าน cTrader Store รวมถึงบอทการเทรด อินดิเคเตอร์ และปลั๊กอิน มีให้บริการโดยนักพัฒนาบุคคลที่สามและมีไว้เพื่อวัตถุประสงค์ในการเข้าถึงข้อมูลและทางเทคนิคเท่านั้น cTrader Store ไม่ใช่โบรกเกอร์และไม่ได้ให้คำแนะนำการลงทุน คำแนะนำส่วนบุคคล หรือการรับประกันผลการดำเนินงานในอนาคต


!["Smart Money Concepts (SMC) [Iridio Capital]" โลโก้](https://cdn.ctrader.com/image/webp/28b69fd1-ef54-4bed-9487-07e78e883be4_40934)


ราคา
ตั้งแต่ 28/01/2026