Descripción
🚀 Transforma tu gráfico en un centro estratégico de decisiones
Smart Tech Analysis no es solo un indicador.
Es un panel completo de análisis inteligente, desarrollado para traders que desean claridad, precisión y agilidad en la toma de decisiones.
Mientras que la mayoría de los indicadores entregan solo información aislada, Smart Tech Analysis integra:
✔ Tendencia
✔ Volumen
✔ Fibonacci
✔ Soporte y Resistencia
✔ Señales Técnicas
✔ Recomendaciones Operativas
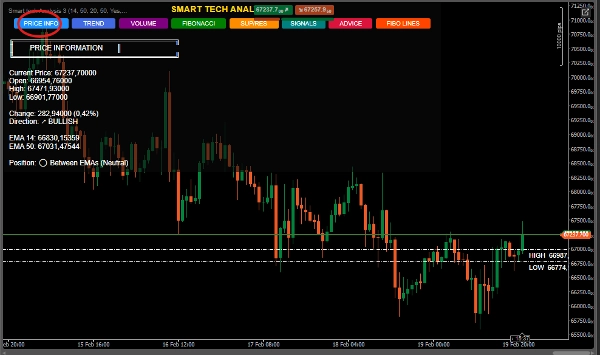
✔ Información Detallada del Precio
Todo en un solo panel dinámico e interactivo.
🔥 LA GRAN DIFERENCIA
🎯 1. Sistema 6 en 1 – Análisis Integrado
Ya no necesitas cambiar entre múltiples indicadores.
Smart Tech Analysis combina:
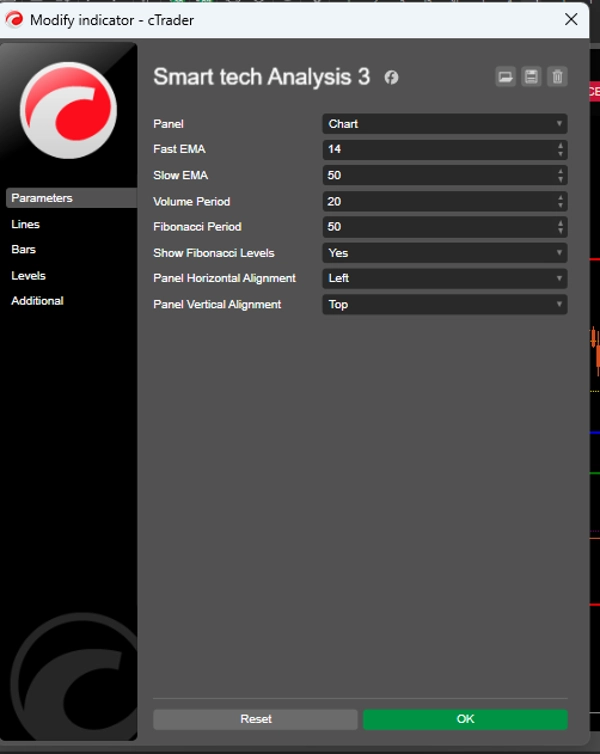
📈 EMAs rápidas y lentas (14 y 50)
📊 Volumen con análisis comparativo
🧩 Fibonacci automático
🛡 Soporte y resistencia dinámicos
🚦 Generación inteligente de señales
📌 Recomendaciones con stop y objetivo calculados
👉 Esto reduce el ruido visual y aumenta la objetividad.
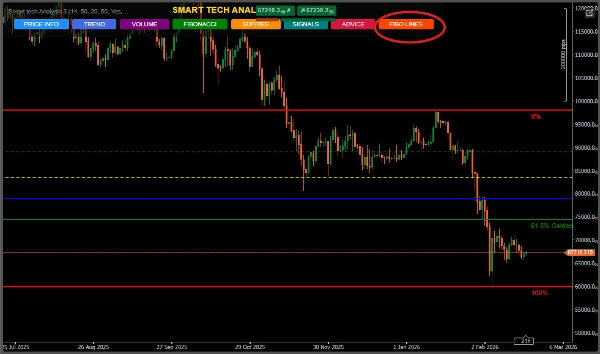
🧠 2. Panel Interactivo Exclusivo
Interfaz profesional con botones inteligentes:
INFO DE PRECIO
TENDENCIA
VOLUMEN
FIBONACCI
SOP/RES
SEÑALES
CONSEJOS
El trader elige exactamente lo que quiere ver.
📌 Organización.
📌 Control.
📌 Profesionalismo.
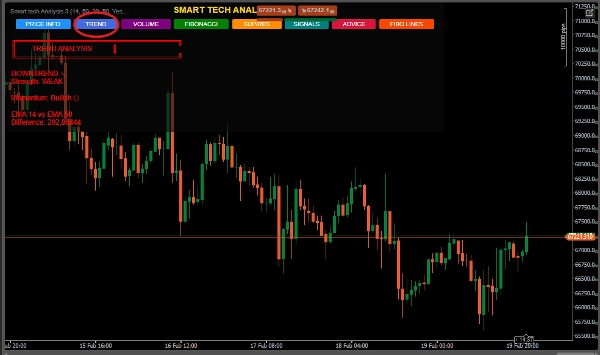
📈 3. Análisis de Tendencia con Fuerza y Momentum
No solo muestra si está subiendo o bajando.
Calcula:
Intensidad de la tendencia
Porcentaje de fuerza entre EMAs
Clasificación: Débil, Moderada o Fuerte
Esto evita entradas débiles en mercados laterales.
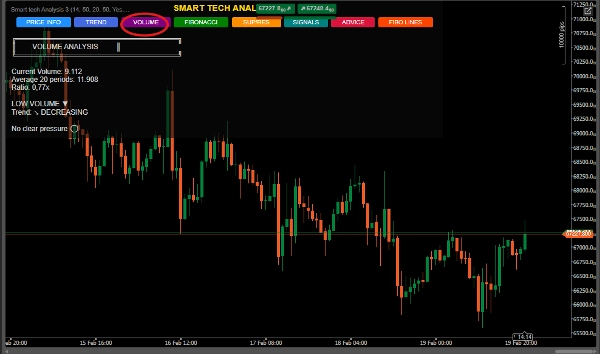
📊 4. Volumen con Lectura Institucional
El sistema identifica:
Volumen extremo
Presión de compra o venta
Aceleración o desaceleración
Comparación con el promedio histórico
👉 Ideal para detectar posible actividad institucional.
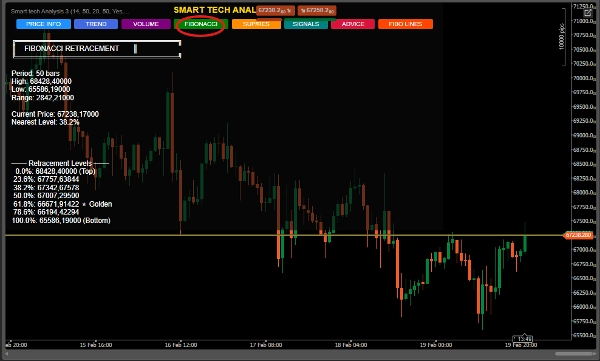
🧩 5. Fibonacci Automático con Zona Dorada
Calculado dinámicamente sobre el período definido.
Destacado especial para:
⭐ Zona 61.8% (Zona Dorada)
📌 Identificación del nivel más cercano
📌 Extensiones alcistas y bajistas
📌 Recomendación contextual automática
Perfecto para traders de retrocesos y swing traders.
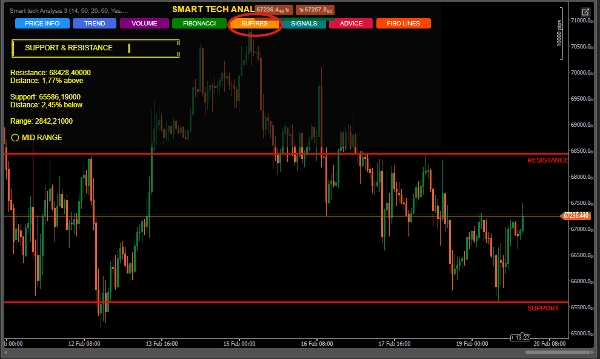
🛡 6. Soporte y Resistencia Inteligentes
Detecta máximos y mínimos relevantes
Muestra distancia porcentual desde el precio actual
Clasifica posición: Cerca de soporte, resistencia o rango medio
Dibuja líneas automáticas en el gráfico
Ideal para entrar en zonas estratégicas.
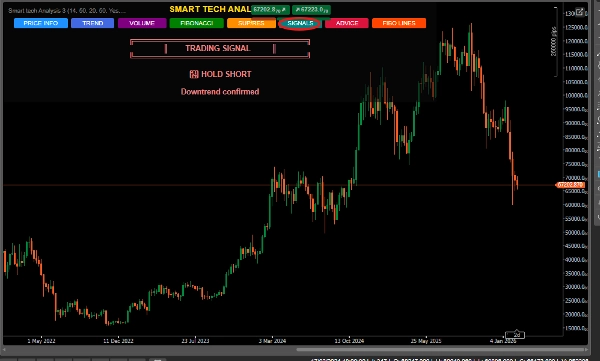
🚦 7. Sistema de Señales por Confluencia
El algoritmo no genera señales aleatorias.
Combina:
✔ Cruce de EMAs
✔ Proximidad a soporte/resistencia
✔ Estructura de tendencia
✔ Contexto de precio
Clasificación:
🟢 COMPRA FUERTE
🔴 VENTA FUERTE
📈 MANTENER LARGO
📉 MANTENER CORTO
⏸ ESPERAR
Con nivel de confianza indicado.
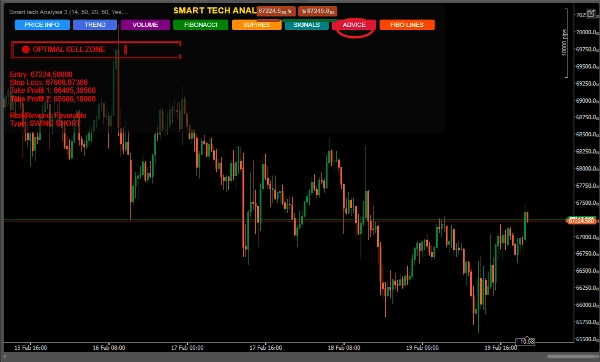
🎯 8. Recomendaciones con Gestión de Riesgo
El panel "CONSEJOS" entrega:
Entrada sugerida
Stop Loss técnico
Dos objetivos de Take Profit
Estructura swing (Largo o Corto)
Contexto de operación
👉 No es solo análisis.
👉 Es un plan estructurado.
🏆 ¿Para quién es este indicador?
✔ Traders principiantes que necesitan claridad
✔ Traders intermedios que buscan confluencia
✔ Traders avanzados que buscan eficiencia
✔ Swing traders
✔ Scalpers que usan confirmación estructural
💎 ¿Por qué destaca en el mercado? Indicadores Comunes Smart Tech Analysis
Información Aislada Análisis Integrado Contaminación Visual Panel Organizado Sin Contexto Confluencia Técnica Sin Gestión Stop y Objetivo Sugeridos Señales Simples Señales con Confirmación
📊 Beneficios Directos
✔ Reduce decisiones emocionales
✔ Aumenta la precisión
✔ Mejora la lectura estructural
✔ Ahorra tiempo
✔ Eleva el estándar profesional del trader
🧠 Posicionamiento en el Mercado
Smart Tech Analysis es ideal para:
Mercado Forex
Índices
Commodities
Criptomonedas


