
Beschreibung
Was PrometheusSMC analysiert
PrometheusSMC liest Preisstruktur, Volumen und Volatilität über mehrere Zeitrahmen hinweg, um zu erkennen, wo institutionelle Aktivitäten höchstwahrscheinlich den Preis beeinflussen. Es verarbeitet sechs Datenschichten bei jedem Balken:
- Marktstruktur — Swing-Hochs/-Tiefs (verzögert durch StructureStrength-Balken zur Bestätigung), BOS (Trendfortsetzung) und CHoCH (Umkehr)
- Orderblöcke — Zonen, in denen institutionelle Aufträge wahrscheinlich akkumuliert wurden, gefiltert durch Volumen, das den OB-Volumen-Schwellenwert in Standardabweichungen über dem Mittelwert überschreitet
- Fair Value Gaps — 3-Kerzen-Preisungleichgewichte mit Füllverfolgung; Zonen werden entfernt, sobald der Preis durch den Gap-Körper handelt (nicht nur die Kante)
- Liquiditäts-Sweeps — erkennt, wenn der Preis über einen vorherigen Swing-Punkt hinaus peitscht, bevor er sich umkehrt, das klassische Stop-Hunt-Muster
- Trendregime — EMA-Crossover kombiniert mit ADX-Volatilitätsfilter und Bollinger-Band-Breite zur Klassifizierung des Marktes als trendend, seitwärts oder unruhig
- Sitzungs-Kontext — identifiziert Dead-Zone-Stunden (07:00 und 11:00 UTC), in denen Signale gedämpft werden, um Rauschen zu reduzieren
Wie man Signale und visuelle Elemente interpretiert
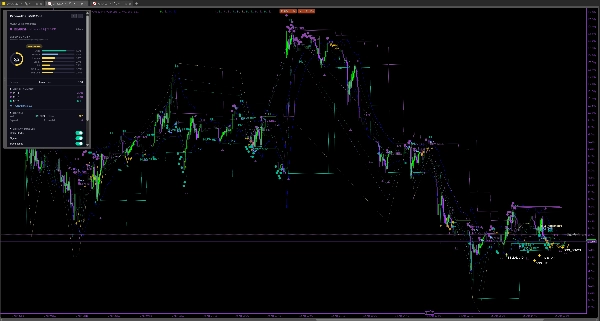
Pfeile und Beschriftungen:
- REV BUY / REV SELL Pfeile markieren CHoCH (Change of Character) — das erste Anzeichen, dass sich ein Trend umkehren könnte
- CONT BUY / CONT SELL Pfeile markieren BOS (Break of Structure) — Trendfortsetzung
- Pfeilfarbe spiegelt die Setup-Qualitätsstufe wider: cyan = HOCH, grün = GUT, lila = MODERAT, himmelblau = MODERAT, gelb = SCHWACH, grau = SCHLECHT
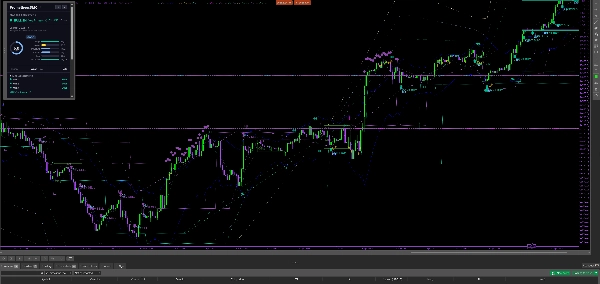
Farbige Zonen:
- Grün/lila Rechtecke markieren bullishe/bearishe Orderblöcke; Zonen verblassen, sobald sie entschärft sind
- Türkis/lila gepunktete Linien markieren ungefüllte Fair Value Gaps; sie verschwinden, sobald der Preis durch die Lücke handelt
- Lila/cyan Ankerlinien erstrecken sich von CHoCH-Punkten und zeigen den Ursprung der Umkehr
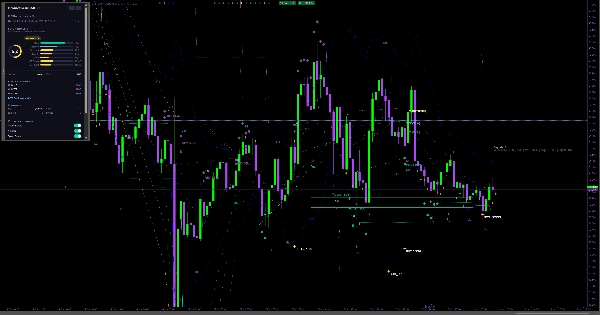
TP/SL-Niveaus:
- TP1 und TP2 verwenden feste Multiplikatoren vom Einstieg (Standard 1,5× und 2,5× Risiko)
- TP3 zielt auf den gegenüberliegenden Liquiditätspool (nächster Swing-Punkt oder Orderblock oberhalb/unterhalb des Einstiegs) — das Strukturziel für die große Bewegung
- SL wird am Extrem des Orderblocks mit einem konfigurierbaren Multiplikator-Puffer platziert
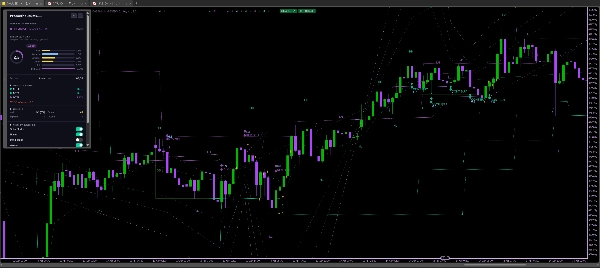
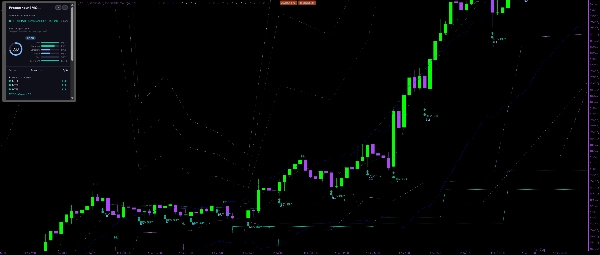
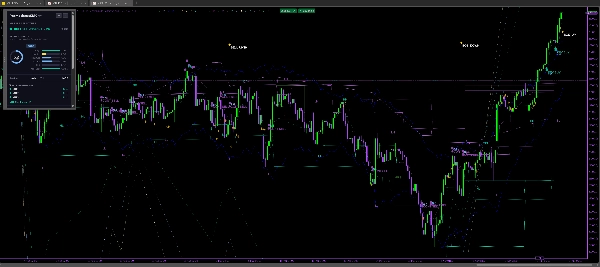
Das Dashboard zeigt aktuellen Trend, aktiven Setup-Score, MTF-Ausrichtung über drei Zeitrahmen, Sitzungsstatus, Sweep- und FVG-Präsenz sowie die berechnete Positionsgröße basierend auf Ihrem Kontorisiko %.
Wichtige Einstellungen und Parameter
Structure Strength (Standard: 4) — Balken zur Bestätigung eines Swing-Punkts. Höher = weniger, aber bedeutendere Strukturbrüche.
Lookback Period (Standard: 12) — Balken für Volumendurchschnitt und OB-Scan.
OB Volume Threshold (Standard: 1,8σ) — Wie viel Volumen den Mittelwert überschreiten muss, um einen Orderblock zu validieren.
Mindestpunktzahl für Signal (Standard: 6, Bereich: 0-10) — Qualitätsgrenze. Signale werden nur ausgelöst, wenn die zusammengesetzte Punktzahl diese Schwelle erreicht.
Sweep Bonus Weight (Standard: 1,0) — Wie sehr ein Liquiditäts-Sweep vor CHoCH den Setup-Score erhöht.
FVG Bonus Weight (Standard: 0,5) — Wie sehr die Nähe zu einem ungefüllten FVG den Setup-Score erhöht.
Sweep Lookback Bars (Standard: 0 / auto) — Wie weit zurück nach Swing-Punkten gesucht wird, wenn Sweeps geprüft werden. Auto = Structure Strength × 4. Erhöhen Sie auf 100-200 bei niedrigeren Zeitrahmen, um tägliche Sweeps zu erfassen.
Aktivieren Sie strukturbasierte TP (Standard: an) — Wenn aktiviert, zielt TP3 auf den gegenüberliegenden Swing-Punkt oder Orderblock statt auf einen festen Multiplikator.
MTF1 / MTF2 / MTF3 Zeitrahmen (Standard: 60 / 240 / 1440 min) — Drei höhere Zeitrahmen für Ausrichtungspunkte.
Risiko pro Trade % (Standard: 1,0%) — Wird für die Positionsgrößenberechnung im Dashboard verwendet.
Dashboard anzeigen (Standard: an) — On-Chart HUD mit Score, Trend und MTF-Ausrichtung.
WebView Dashboard verwenden (Standard: aus) — Erweitertes HTML-Dashboard mit mehr Details. Erfordert Windows- oder macOS-cTrader Desktop.
Typische Anwendungsfälle
Scalping auf 1-5m mit Strukturkontext: Stellen Sie Structure Strength auf 2-3 für schnellere Signale, senken Sie Mindestpunktzahl für Signal auf 5 und verwenden Sie den 60m MTF für Bias. Die Conviction-Heatmap ermöglicht es, qualitativ schlechte Einstiege auf einen Blick zu überspringen.
Intraday auf 15m: Standardeinstellungen funktionieren gut. Achten Sie auf CHoCH-Pfeile mit Sweep-Bonus (cyan/grün) während der London- oder New York-Sitzungen. Nehmen Sie TP1 schnell mit, lassen Sie TP3 zum gegenüberliegenden Liquiditätspool laufen.
Swing auf 1H/4H: Erhöhen Sie Structure Strength auf 5-6 für bedeutende Strukturbrüche. Stellen Sie Sweep Lookback Bars auf 200+ ein, um Sweeps von Wochenhochs/-tiefs zu erfassen. Erhöhen Sie Mindestpunktzahl für Signal auf 7-8 für weniger, aber qualitativ hochwertigere Einstiege.
Konfluenzfilter: Aktivieren Sie MTF-Ausrichtung und verlangen Sie, dass mindestens 2 von 3 Zeitrahmen der Signale Richtung zustimmen, bevor Sie einsteigen.
Für wen dieser Indikator am besten geeignet ist
PrometheusSMC ist für Trader entwickelt, die Smart Money Concepts (Orderblöcke, Fair Value Gaps, Liquiditäts-Sweeps, Marktstruktur) bereits verstehen und ein konsistentes, regelbasiertes System zur Identifizierung und Bewertung von Setups wünschen. Es ist kein Plug-and-Play
Signalservice — die Qualitätsbewertung erfordert, dass Sie verstehen, was die Komponenten bedeuten und diese auf Ihr Instrument und Ihren Zeitrahmen abstimmen.
Erfahrungslevel: Mittel bis fortgeschritten. Anfänger können es nutzen, um SMC zu lernen, indem sie beobachten, wie Struktur, OBs und FVGs interagieren, sollten aber zuerst im Demokonto handeln und die Bewertungsaufteilung studieren, bevor sie Kapital riskieren.
Handelsstil: Intraday- und Swing-Trader auf Forex, Indizes (US30, NAS100) und Gold (XAUUSD). Scalper können es mit reduzierter Strukturstärke verwenden. Es enthält Voreinstellungen für XAUUSD, US30, NAS100 und wichtige Forex-Paare.
Wichtige Einschränkungen und Nutzungshinweise
- Nicht nachzeichnend: Ausgabereihen (Pfeile, Beschriftungen, Zonen) erscheinen nur auf bestätigten Balken. Der Live-Balken aktualisiert die interne Bewertung reaktionsschnell, aber der strukturelle Zustand (Swing-Punkte, Trendrichtung, Orderblöcke, FVGs) wird erst beim Balkenschluss festgeschrieben. Das bedeutet
der letzte Balken in Ihrem Chart kann sich verschieben, wenn sich der Preis bewegt — dies ist erwartetes und korrektes Verhalten
- Keine garantierte Profitabilität: PrometheusSMC identifiziert Struktur und bewertet Konfluenz; es sagt die Richtung nicht voraus. Jedes Setup kann fehlschlagen. Verwenden Sie immer ein angemessenes Risikomanagement und riskieren Sie niemals mehr, als Sie sich leisten können zu verlieren
- WebView Dashboard erfordert cTrader Desktop auf Windows oder macOS. Es wird nicht auf cTrader Web oder Mobile angezeigt. Das On-Chart-Dashboard funktioniert auf allen Plattformen
- Voreingestellte Instrumente (XAUUSD, US30 usw.) passen Strukturstärke, EMA-Perioden und OB-Schwellenwerte für jeden Markt an. Wenn Ihr Instrument nicht in der Voreinstellungsliste ist, beginnen Sie mit den Standardwerten und passen Sie diese an
- Historische Leistung, die durch Backtests oder Chart-Wiedergabe gezeigt wird, garantiert keine zukünftigen Ergebnisse. Frühere Signale, die im Chart sichtbar sind, können in Echtzeit besser aussehen als sie waren, aufgrund der Natur der nur bestätigten Balkenausgabe


