

Descripción
ESCÁNER DE ZONAS DE CONSOLIDACIÓN DE ALTO VALOR
Detección inteligente de consolidación con visualización de mapa de calor
--------------------------------------------------
Encuentre zonas de consolidación con alta probabilidad. Vea dónde se negoció realmente el precio.
--------------------------------------------------
LO QUE HACE ESTE INDICADOR
La mayoría de los escáneres de consolidación simplemente dibujan cuadros alrededor de los rangos de precios. Este indicador va más allá al analizar la calidad de cada toque, distinguiendo entre toques con cuerpo dentro de la zona (participación fuerte) y toques solo con mecha (participación débil).
El resultado es un mapa de calor que le muestra exactamente dónde el precio ha pasado más tiempo dentro de cada zona, ayudándole a identificar los niveles más confiables para entradas, salidas y colocación de stops.
--------------------------------------------------
LÓGICA Y CÁLCULO PRINCIPAL
El indicador escanea la acción reciente del precio en busca de rangos de velas superpuestos. Cuando un número suficiente de velas se superpone de manera consistente, se detecta una zona de consolidación. El número mínimo de velas consecutivas requerido es configurable, al igual que el número máximo de velas disidentes permitidas dentro de la secuencia.
Para cada zona, el indicador rastrea cuántas velas tienen su cuerpo dentro de la zona frente a cuántas solo tocan la zona con sus mechas. Las velas con cuerpo dentro de la zona indican participación fuerte, mientras que las velas solo con mecha indican interés más débil. Esta distinción forma la base de la puntuación de fuerza.
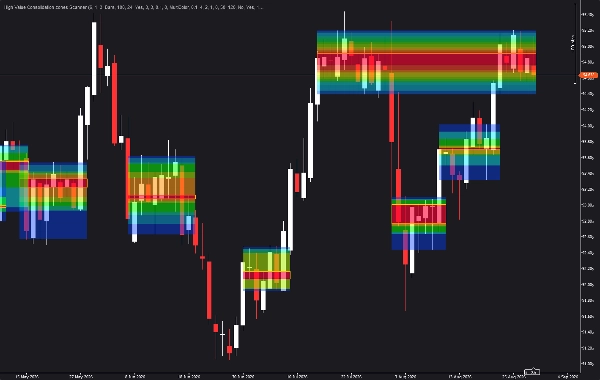
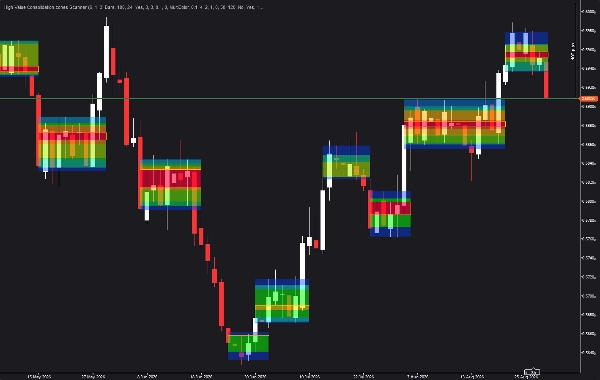
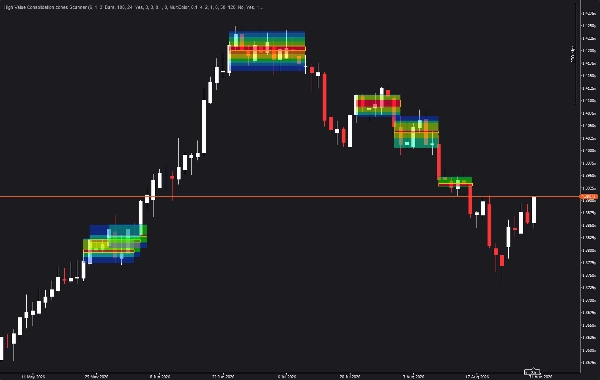
Se construye un mapa de calor dinámico analizando la distribución de la actividad de las velas dentro de cada zona. Los niveles de precio con mayor actividad se muestran en colores cálidos (rojo/naranja), mientras que los niveles con menor actividad se muestran en colores fríos (azul). Esto proporciona una visualización inmediata de dónde se ha negociado realmente el precio.
Se pueden fusionar múltiples zonas si se superponen en precio y están cerca en el tiempo, reduciendo el desorden del gráfico y creando zonas más amplias y significativas.
--------------------------------------------------
CARACTERÍSTICAS CLAVE
- DETECCIÓN AUTOMÁTICA DE CONSOLIDACIÓN: Identifica zonas donde las velas se superponen consistentemente, con mínimo configurable de velas consecutivas y tolerancia a disidencias.
- VISUALIZACIÓN DE MAPA DE CALOR: Muestra la densidad de actividad dentro de cada zona, con colores cálidos que indican mayor actividad de velas.
- PUNTUACIÓN CUERPO VS MECHA: Distingue toques fuertes (cuerpo en zona) de toques débiles (solo mecha), proporcionando una puntuación de fuerza para cada zona.
- LÓGICA DE FUSIÓN: Las zonas adyacentes que se superponen en precio y están cerca en tiempo se fusionan en zonas más amplias y significativas.
- ALERTAS DE RE-ENTRADA EN ZONA: Alertas opcionales cuando el precio reingresa a una zona detectada previamente, con tiempo de espera configurable.
- DESVANECIMIENTO POR ANTIGÜEDAD: Las zonas se desvanecen gradualmente con el tiempo, manteniendo el enfoque en áreas recientes y relevantes.
- PERÍODO DE RETROCESO CONFIGURABLE: Elija entre períodos basados en barras o en horas.
- FILTRADO POR FUERZA: Filtra zonas débiles basándose en una puntuación mínima de fuerza.
- VISUALES PERSONALIZABLES: Color de zona, opacidad del relleno, grosor del borde, posición de la etiqueta y extensión hacia la derecha en barras.
--------------------------------------------------
GUÍA DE PARÁMETROS
CONFIGURACIONES
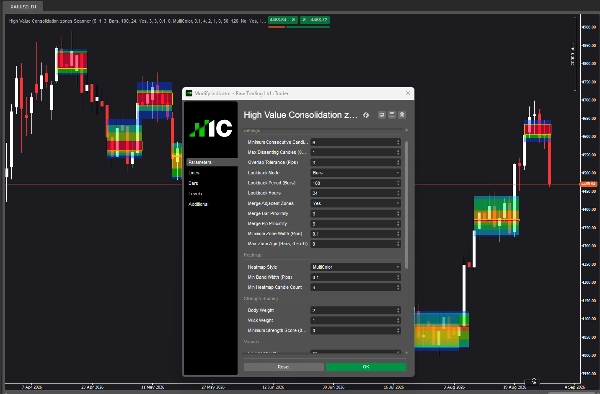
Velas Consecutivas Mínimas: El número mínimo de velas que deben superponerse consistentemente para formar una zona. Valores más altos producen zonas más grandes y significativas. Valores más bajos producen zonas más pequeñas. El valor predeterminado es 6.
Velas Disidentes Máximas: El número máximo de velas que no se superponen permitidas dentro de la secuencia. Un valor de 0 requiere superposición consecutiva perfecta. Valores más altos permiten algunos espacios. El valor predeterminado es 1.
Tolerancia de Superposición (Pips): La tolerancia en pips para considerar una vela como superpuesta a la zona. El valor predeterminado es 3.0. Aumente esto para zonas más amplias en pares volátiles. Disminuya para zonas más ajustadas.
Modo de Retroceso: Elija entre Barras y Horas para el período de retroceso. El modo Barras usa un número fijo de velas. El modo Horas calcula el número de velas basado en el marco temporal del gráfico.
Período de Retroceso (Barras): El número de barras para escanear zonas. El valor predeterminado es 100. Aumente para zonas a largo plazo en marcos temporales mayores. Disminuya para enfocarse en actividad reciente en marcos temporales menores.
Horas de Retroceso: El número de horas para escanear zonas. El valor predeterminado es 24. Usar con modo Horas.
Fusionar Zonas Adyacentes: Cuando está habilitado, las zonas que se superponen en precio y están cerca en tiempo se fusionan. El valor predeterminado es verdadero.
Proximidad de Barras para Fusión: El número máximo de barras entre zonas para considerarlas para fusión. El valor predeterminado es 3.
Proximidad en Pips para Fusión: La distancia máxima en precio en pips para considerar zonas para fusión. El valor predeterminado es 3.0.
Ancho Mínimo de Zona (Pips): El ancho mínimo que debe tener una zona para ser mostrada. El valor predeterminado es 0.1. Aumente para filtrar zonas extremadamente estrechas.
Edad Máxima de Zona (Barras): La edad máxima de una zona en barras. Las zonas más antiguas que esta se eliminan. El valor predeterminado es 0 (desactivado).
MAPA DE CALOR
Estilo de Mapa de Calor: Elija entre Apagado, Multicolor o Color Único. Multicolor usa el espectro completo de azul a rojo. Color Único usa variaciones del color de zona seleccionado.
Ancho Mínimo de Banda (Pips): El ancho mínimo de bandas individuales del mapa de calor. El valor predeterminado es 0.1.
Conteo Mínimo de Velas en Mapa de Calor: El número mínimo de velas que deben superponerse a una banda para que esta se muestre. El valor predeterminado es 4. Aumente para mostrar solo las bandas más activas.
PUNTUACIÓN DE FUERZA
Peso del Cuerpo: El peso asignado a las velas con cuerpo dentro de la zona en la puntuación de fuerza. El valor predeterminado es 2.0. Valores más altos priorizan velas con cuerpo dentro de la zona.
Peso de la Mecha: El peso asignado a las velas solo con mecha en la puntuación de fuerza. El valor predeterminado es 1.0. Valores más bajos reducen la importancia de los toques solo con mecha.
Puntuación Mínima de Fuerza: La puntuación mínima de fuerza requerida para que una zona se muestre. El valor predeterminado es 0 (desactivado). Aumente para filtrar zonas débiles.
VISUALES
Porcentaje de Opacidad del Relleno: La opacidad del relleno de la zona. El valor predeterminado es 50 por ciento.
Porcentaje de Intensidad del Color: La intensidad de los colores de la zona. El valor predeterminado es 120 por ciento.
Habilitar Desvanecimiento por Antigüedad: Cuando está habilitado, las zonas se desvanecen con el tiempo. El valor predeterminado es falso.
Mostrar Borde Principal: Cuando está habilitado, se dibuja un borde alrededor de la zona. El valor predeterminado es verdadero.
Grosor del Borde: El grosor del borde de la zona. El valor predeterminado es 1.
Color de la Zona: El color usado para las zonas cuando el mapa de calor está apagado o en modo Color Único. El valor predeterminado es Oro.
Mostrar Etiqueta: Cuando está habilitado, se muestra una etiqueta en cada zona. El valor predeterminado es falso.
Mostrar Fuerza en la Etiqueta: Cuando está habilitado, la puntuación de fuerza se muestra en la etiqueta. El valor predeterminado es falso.
Posición de la Etiqueta: Posición de la etiqueta en la zona: Arriba, Centro o Abajo. El valor predeterminado es Centro.
Color de la Etiqueta: El color de la etiqueta de la zona. El valor predeterminado es Blanco.
Extender Barras a la Derecha: El número de barras para extender la zona hacia la derecha. El valor predeterminado es 0.
ALERTAS
Alerta en Re-entrada de Zona: Cuando está habilitado, se activan alertas cuando el precio reingresa a una zona. El valor predeterminado es falso.
Tiempo de Espera entre Alertas (Barras): El número mínimo de barras entre alertas para la misma zona. El valor predeterminado es 5.
--------------------------------------------------
CASOS DE USO
- Identificar zonas de consolidación para estrategias de ruptura o reversión a la media
- Usar la puntuación cuerpo en zona vs solo mecha para evaluar la calidad de la zona
- El mapa de calor revela los niveles de precio más activos dentro de cada zona
- Las alertas de re-entrada en zona capturan re-tests de niveles clave
- Usar con indicadores de tendencia para filtrar zonas según la dirección del mercado
- Colocar stops por encima o por debajo de zonas de consolidación de alta calidad
--------------------------------------------------
FLUJO DE TRABAJO RECOMENDADO
Paso 1: Adjunte el indicador a su gráfico con la configuración predeterminada.
Paso 2: Identifique zonas con altas puntuaciones de fuerza y altas proporciones de cuerpo en zona.
Paso 3: Examine el mapa de calor para ver dónde se concentra la actividad del precio.
Paso 4: Use las zonas como niveles potenciales de soporte/resistencia para entradas y salidas.
Paso 5: Habilite alertas para re-entrada en zona para capturar re-tests.
--------------------------------------------------
EJEMPLO PRÁCTICO
En un gráfico EURUSD H1, el indicador detecta una zona de consolidación entre 1.0850 y 1.0875 con 10 velas consecutivas. La zona tiene 8 velas con cuerpo en zona y 2 velas solo con mecha, dando una puntuación de fuerza de 18 (8*2 + 2*1).
El mapa de calor muestra actividad concentrada entre 1.0860 y 1.0870 (banda roja), indicando dónde el precio ha pasado más tiempo. Esta se convierte en su área de enfoque para entradas.
Cuando el precio rompe por encima de la zona y luego la retesta, la alerta de re-entrada se activa, proporcionando una posible oportunidad de segunda entrada.
--------------------------------------------------
NOTAS TÉCNICAS
- Indicador superpuesto (dibuja sobre el gráfico de precios)
- Funciona en cualquier marco temporal y símbolo
- Retroceso configurable (barras o horas)
- Sin repintado; los cálculos son históricos
- Optimizado para rendimiento
- Compatible con cTrader
--------------------------------------------------
SOPORTE
Actualizaciones de por vida incluidas.
PARA MÁS INFORMACIÓN - Haga clic en el perfil del desarrollador a continuación.
Resumen
The indicator presents a dynamic heatmap within each zone, highlighting price levels with the highest trading activity using color gradients from cool (low activity) to warm (high activity). Adjacent zones that overlap in price and are close in time can be merged to reduce chart clutter and form broader zones. Zones can fade as they age to maintain focus on recent price action.
Additional features include configurable lookback periods (bars or hours), customizable visual settings (color, opacity, border thickness, labels), and optional alerts for price re-entry into detected zones. The scanner supports filtering zones by strength score and provides practical use cases for breakout or mean-reversion strategies, stop placement, and identifying key support and resistance levels. Calculations are historical with no repainting, optimized for performance.



























