present
Regístrese y obtenga 50 $ de descuento en su primera compra
Trading product for Helix Volume Profile Indicador Key Levels Volume, image 1
Helix Volume Profile
Indicador
Versión 1.0, Sep 2026
Windows, Mac
4.0
Valoraciones: 1
Trading product for Helix Volume Profile Indicador Key Levels Volume, image 2
Trading product for Helix Volume Profile Indicador Key Levels Volume, image 3
Trading product for Helix Volume Profile Indicador Key Levels Volume, image 4
Trading product for Helix Volume Profile Indicador Key Levels Volume, image 5
Trading product for Helix Volume Profile Indicador Key Levels Volume, image 6
Trading product for Helix Volume Profile Indicador Key Levels Volume, image 7
Trading product for Helix Volume Profile Indicador Key Levels Volume, image 8
Trading product for Helix Volume Profile Indicador Key Levels Volume, image 9
Trading product for Helix Volume Profile Indicador Key Levels Volume, image 10
Trading product for Helix Volume Profile Indicador Key Levels Volume, image 11
15
Ventas
299
Instalaciones gratis

Descripción

Helix Volume Profile construye una imagen completa de la sesión de marco temporal superior en la que se encuentra el gráfico actual.

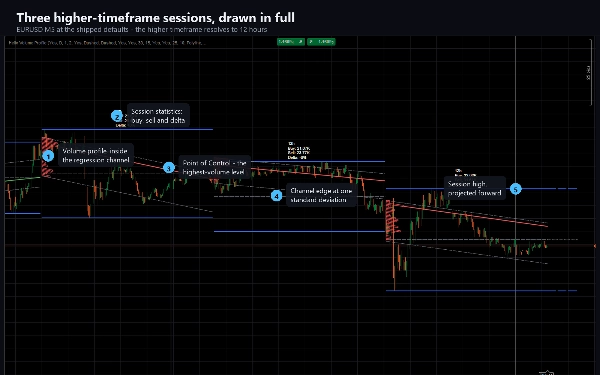
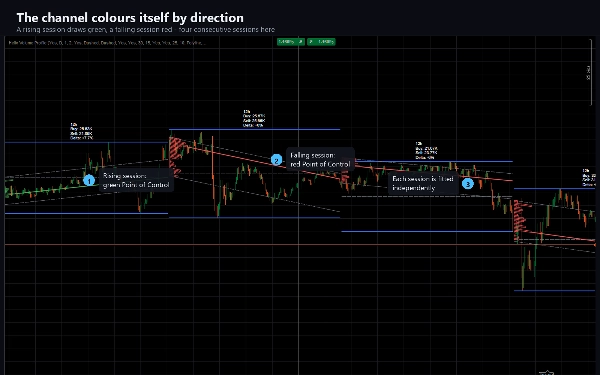
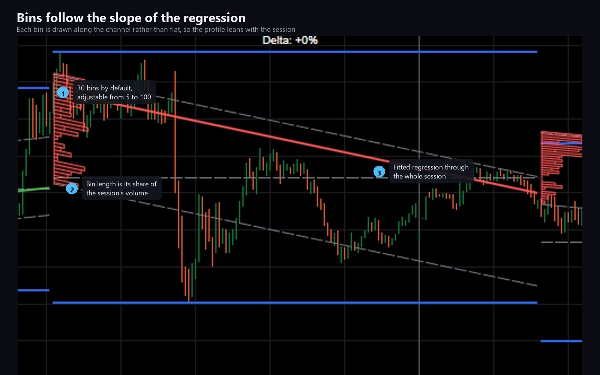
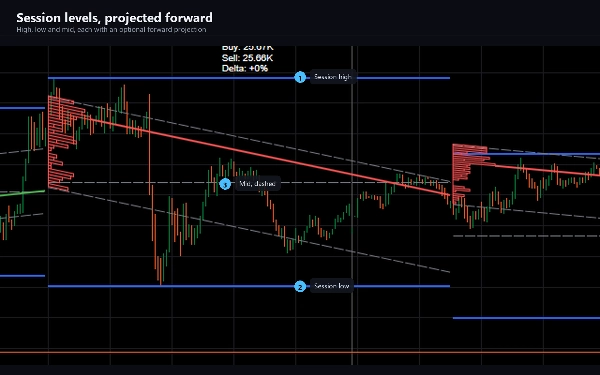
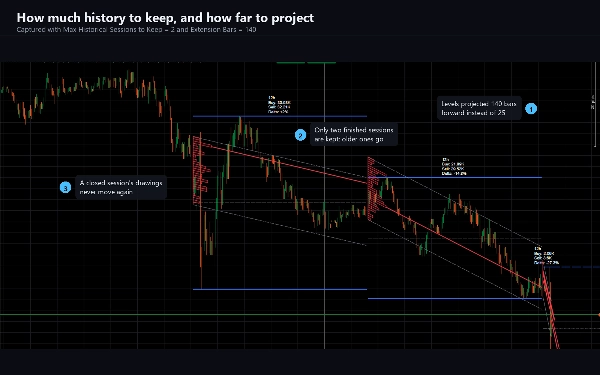
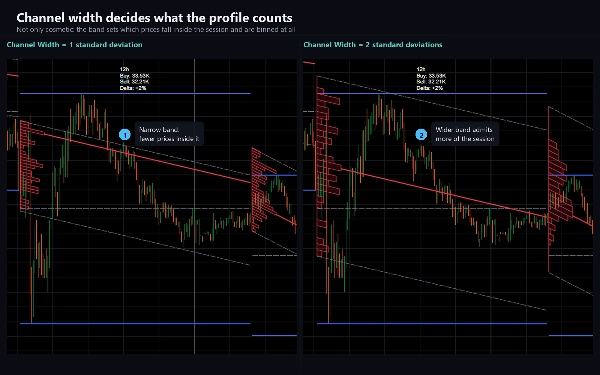
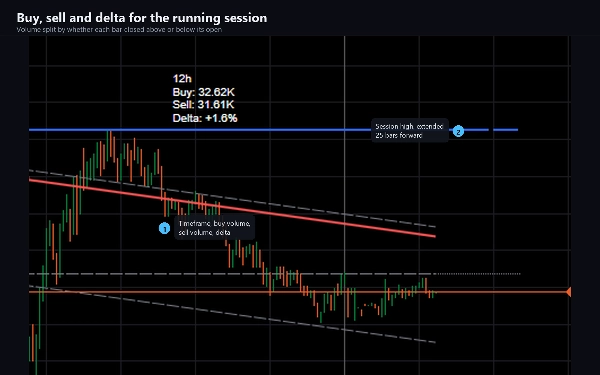
Para cada sesión, ajusta una regresión logarítmica a través de cada barra hasta ahora, dibuja un canal con un número configurable de desviaciones estándar a su alrededor y llena ese canal con un perfil de volumen cuyos contenedores siguen la pendiente de la regresión en lugar de estar planos. El contenedor de mayor volumen se marca con una línea de Punto de Control, coloreada según la dirección en la que se mueve el canal. Se dibujan los niveles alto, bajo y medio de la sesión junto a él y pueden proyectarse hacia adelante, y una etiqueta compacta informa el volumen de compra, el volumen de venta y la diferencia entre ellos.

El marco temporal superior se elige por defecto para usted y se adapta al gráfico: una sesión de 12 horas en M5, cuatro horas en M1, dos días en M15, una semana en H1, un mes en H4. Puede desactivar esto y establecer la sesión usted mismo: se aceptan minutos, días, semanas o meses.

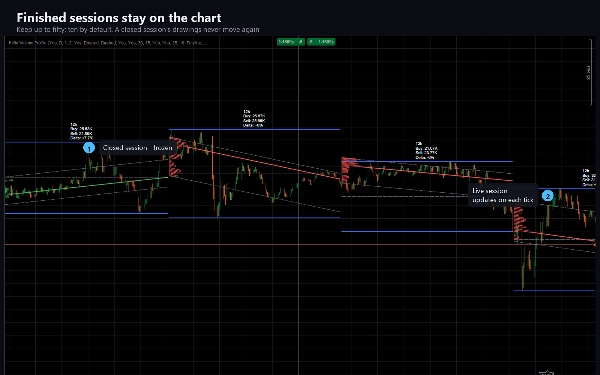
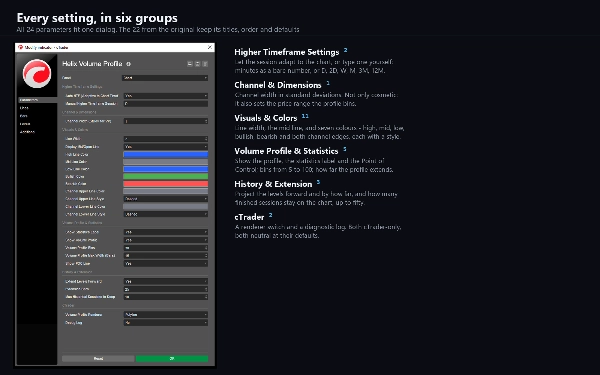
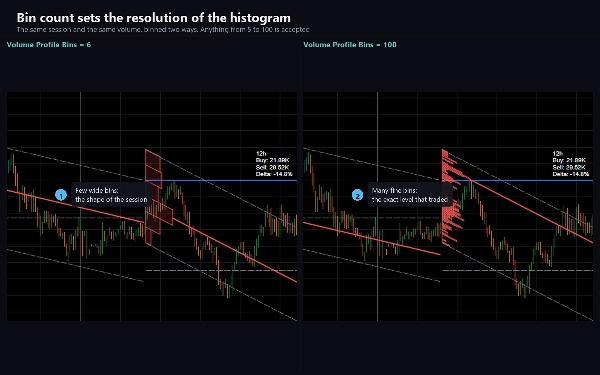
Todo es ajustable. Ancho del canal, el número de contenedores del perfil de 5 a 100, hasta dónde se extiende el perfil, si se muestran el Punto de Control, la etiqueta de estadísticas y las proyecciones hacia adelante, los anchos y estilos de línea, siete colores y cuántas sesiones terminadas permanecen en el gráfico, hasta cincuenta.

PARA QUÉ SIRVE

Leer dónde se encuentra el precio dentro de su estructura de marco temporal superior sin salir de su marco temporal de trabajo. El canal muestra la deriva y dispersión de la sesión; el perfil muestra dónde se acumuló realmente el volumen dentro de ella; el Punto de Control marca el nivel que vio la mayor actividad. Los traders usan esto para enmarcar soporte y resistencia, para juzgar si un movimiento está estirado en relación con la sesión y para ver si predominó la compra o la venta.

Adecuado para cualquier instrumento y cualquier marco temporal. Es más informativo en gráficos intradía de M1 a H4, donde la sesión adaptativa ofrece una ventana significativa; en Diario y superiores, establezca la sesión manualmente.

CÓMO SE COMPORTA

La sesión en vivo se actualiza en cada tick y sus dibujos se mueven hasta que la sesión cierra: el canal se reajusta, el perfil se reconstruye y los niveles se vuelven a medir a medida que llega cada barra. Una vez que una sesión termina, sus dibujos se congelan y nunca cambian más. Esto es deliberado y es cómo funciona el método; si necesita niveles que nunca se muevan intrabar, lea una sesión cerrada en lugar de la sesión en vivo.

El volumen en un símbolo forex es el recuento de ticks que reporta su bróker, por lo que el perfil refleja su propia fuente de datos.

TÉCNICO

Indicador, superposición. 24 parámetros. Sin permisos de trading, sin acceso a archivos ni a red: está construido con AccessRights configurado en None y no puede realizar órdenes. Incluye una edición de prueba restringida a EURUSD sin límite de tiempo y sin funciones deshabilitadas.

La documentación cubre la instalación, cada parámetro con su propósito y una guía de solución de problemas que explica cada comportamiento que sorprende a la gente.

El trading implica riesgos. El rendimiento pasado no garantiza resultados futuros.

Resumen

Resumen de IA
Helix Volume Profile is a technical indicator overlay designed to analyze higher-timeframe sessions within the current chart timeframe. It fits a logarithmic regression channel to the session's price bars, adjustable by standard deviations, and overlays a volume profile aligned with the channel's slope. The indicator highlights the Point of Control—the price level with the highest traded volume—colored according to the channel's direction. It also displays session high, low, and midpoint levels, which can be projected forward, alongside a label showing buy volume, sell volume, and their delta.

The higher timeframe session adapts automatically based on the chart timeframe (e.g., 12 hours on M5, one week on H1) but can be manually set to minutes, days, weeks, or months. Users can customize channel width, number of volume bins (5 to 100), profile extension, visibility of elements, colors, line styles, and how many past sessions remain visible (up to 50).

The live session updates on every tick, recalculating the channel and volume profile until session close, after which the data is fixed. Volume data reflects the broker's tick count for forex symbols. Helix Volume Profile is suitable for any instrument and timeframe, with particular utility on intraday charts from M1 to H4. It includes 24 adjustable parameters and operates without trading permissions or network access.
Perfil del indicador
Categoría del indicador
Tendencia
Tipo de resultado
Visualización
Requisitos de datos
Volumen

Conversación

Valoraciones de clientes

4.0
Valoraciones: 1
5
0 %
4
100 %
3
0 %
2
0 %
1
0 %
Valoraciones de clientes
September 18, 2026
Helix Volume Profile combines a sloped regression channel with a direction-aware volume profile, session H/L/Mid levels and forward projections. The profile rendered cleanly on EURUSD and XAUUSD across M1/H1. The main caveat is that the enabled buy/sell/delta statistics label was not visible.

Preguntas frecuentes

Key Levels
Volume
Market Structure
Channel
Support & Resistance
Los productos disponibles a través de cTrader Store, incluidos bots, indicadores y plugins para operar, son proporcionados por desarrolladores de terceros y están disponibles únicamente con fines informativos y de acceso técnico. cTrader Store no es un bróker, por lo que no proporciona asesoramiento de inversión, recomendaciones personales ni ninguna garantía de rentabilidad futura.

Más de este autor

Indicador
ATR
EMA
+3
EMA cross filtered by a trend average and its ATR channel, with long, short and close marks and colored candles.
cBot
Balanced
Fixed Lot
+5
Gold grid cBot for XAUUSD H1: four-signal confluence on closed bars, ladders closed at a basket profit, news filter
15.6%
ROI
2.33
Factor de beneficio
Indicador
ATR
CCI
+4
A trend line that never steps back, a shaded band to the price, and a pointer at the swing where the trend turns.
Indicador
ADX
ATR
+5
EMA-cross signals scored on six confluence layers, with an ATR stop, three targets and a live panel
Indicador
ATR
RSI
+5
Fusion trend line with a layered cloud, BULL and BEAR labels, scored re-entry triangles and exit markers.
Indicador
ATR
RSI
+4
Adaptive Ichimoku with nine-factor confluence scoring, five signal types, smart TP/SL and an MTF panel.
Indicador
ATR
RSI
+4
RSI bands drawn on price, confluence-scored BUY/SELL signals, an ATR stop with three targets
Indicador
ADX
ATR
+5
SuperTrend signals scored on five confluence factors, with an ATR stop, three targets and a dashboard.
Indicador
ADX
ATR
+5
Ten confluence layers scored on every closed bar, with an anti-chop gate, pivot levels and a live dashboard.
cBot
TP Manager
Break Even
+5
Gold cBot for prop-firm accounts: pick your firm, phase and size; risk is sized from the firm's rules, its limits kept
1.6
Factor de beneficio
Indicador
ATR
EMA
+2
Eight-EMA ribbon with ATR trade zones, a nine-symbol screener and a five-timeframe trend dashboard.
Indicador
ATR
Volume
+3
Fibonacci trend signals on closed bars, with an ATR stop, up to four targets and a break-even ladder.

Puede interesarle

Indicador
Advanced price action tool that combines multiple technical analysis concepts
Indicador
ATR
RSI
+1
Super Trend Rsi ,ATR + trend change distance + dynamic Alpha, divergence/convergence
Indicador
AI
ATR
+27
Support and Resistance with signals
Indicador
ATR
Wedge
+2
Strong Supertrend Turn Market Movement into a Clear Map Market analysis
Indicador
AI
ATR
+26
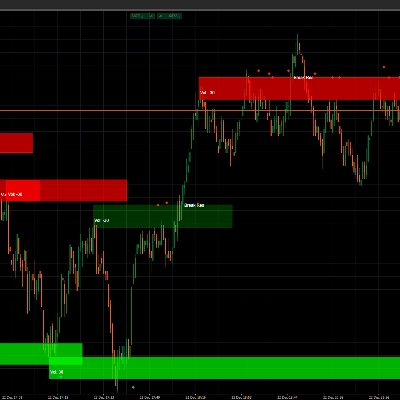
Liquidity Cluster Order automatically detects and draws accumulation zones & distribution zones
Indicador
ATR
RSI
+5
Advanced Anchored VWAP for cTrader: volatility bands, real‑time alerts & customizable session resets.
Indicador
Key Levels
Support & Resistance
Clean psychological round-number grid with native pip and point auto-scaling across Forex, Gold, Indices, and Crypto.
Indicador
Risk Dashboard
AI-powered daily range forecasts help traders spot volatility opportunities and plan stops and targets.
Indicador
MACD
Forex
+6
Auto Signal BUY SELL is a professional decision-making tool designed to help you follow the trend and capture high-proba
Indicador
ATR
EMA
+4
Range-filter BUY/SELL signals scored by four confluence layers, with a stop, five targets and a trend panel
Indicador
Drawdown Monitor
Protect your funded account. Real-time Daily Equity Drawdown monitor with Green / Orange / Red flashing alerts.
Indicador
VWAP
Volume
+2
VWAP Bands and Swing Wick Structure Indicator
Indicador
Allow trader to draw multi trendlines in different timeframes on one chart,Give trader an overview of the current market
Indicador
ATR
RSI
+4
RSI bands drawn on price, confluence-scored BUY/SELL signals, an ATR stop with three targets
Indicador
RSI
Prop
+14
Unlock Stochastic RSI PRO in cTrader! Overlay RSI, highlight zones, and identify divergences with customizable settings.
Indicador
ATR
Market Structure
+3
Support Resistance Toolkit
Indicador
ADX
ATR
+2
GOLD SENTINEL v1.0 - A CANDLE-COLORING INDICATOR FOR GOLD.
Indicador
Prop
Forex
+5
Traders Panel: Scan 15 pairs across 5 timeframes. Live heatmap, strength rankings and best setups in one panel.

Precio

15
Ventas
299
Instalaciones gratis