Descripción
✔ Sitio web para ingresar datos, ingrese a la pestaña de indicadores: https://tradingeconomics.com/
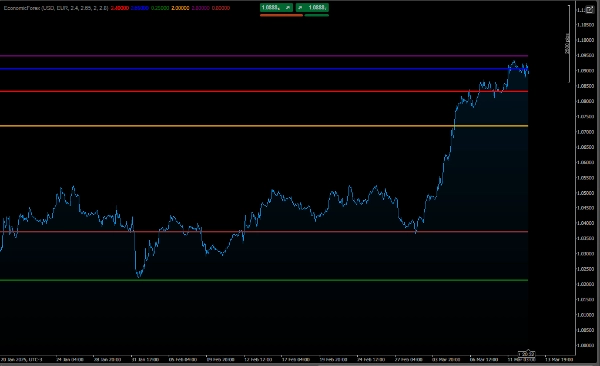
Cómo interpretar el gráfico
Diferencia entre tasas de interés nominales y reales:
La tasa de interés nominal es el valor bruto de la tasa de interés.
La tasa de interés real toma en cuenta la inflación, mostrando el poder adquisitivo real del dinero.
Si la inflación es mayor que la tasa de interés nominal, la tasa de interés real será negativa, indicando una pérdida de poder adquisitivo.
Comparación de monedas:
El gráfico permite comparar las condiciones económicas de las dos monedas.
Por ejemplo, si la tasa de interés real de la moneda principal es mayor que la de la moneda contraparte, esto puede indicar que la moneda principal es más atractiva para la inversión.
Evolución en el tiempo:
Las líneas muestran cómo cambian la inflación, la tasa de interés nominal y la tasa de interés real a lo largo del tiempo, permitiendo identificar tendencias.
Ejemplo de uso
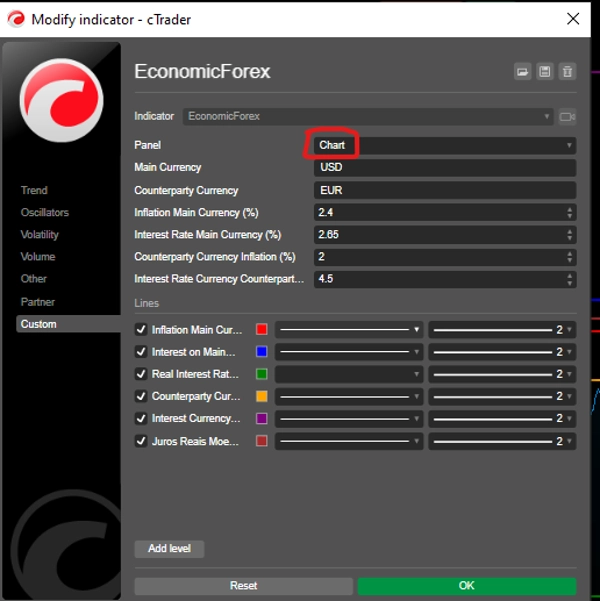
Supongamos que configuras los parámetros de la siguiente manera:
Moneda principal: USD (Dólar estadounidense)
Inflación: 5%
Tasa de interés nominal: 6.5%
Moneda contraparte: EUR (Euro)
Inflación: 2%
Tasa de interés nominal: 4%
El gráfico mostrará:
USD:
Interés real: 1.5% (6.5% - 5%)
EUR:
Interés real: 2% (4% - 2%)
Con esto, puedes comparar las condiciones económicas de USD y EUR y tomar decisiones informadas en el mercado forex.
Conclusión
Este código es una herramienta útil para traders y analistas que desean monitorear y comparar indicadores económicos de dos monedas en un par forex. Proporciona información sobre inflación, tasas de interés nominales y tasas de interés reales, ayudando a comprender el escenario macroeconómico y sus implicaciones para el mercado forex.
ve este algoritmo de bajo riesgo:👇🏻
https://ctrader.com/pt/products/601?u=carneiroads
https://ctrader.com/pt/products/623?u=carneiroads
Resumen
The indicator distinguishes between nominal interest rates (the gross interest rate) and real interest rates (adjusted for inflation), highlighting the purchasing power of money. It allows comparison of economic conditions between a main currency and a counterparty currency by plotting their respective inflation, nominal, and real interest rates over time. This helps identify trends and relative investment attractiveness; for example, a higher real interest rate in the main currency compared to the counterpart may indicate greater investment appeal.
Users input data such as inflation and nominal interest rates for each currency, which can be sourced from economic data websites like TradingEconomics.com. The tool supports informed decision-making in the forex market by providing a clear view of evolving economic factors affecting currency pairs.