RT Bollinger Bands Cloud
Gösterge
Sürüm 1.0, Sep 2024
Windows, Mac
Açıklama
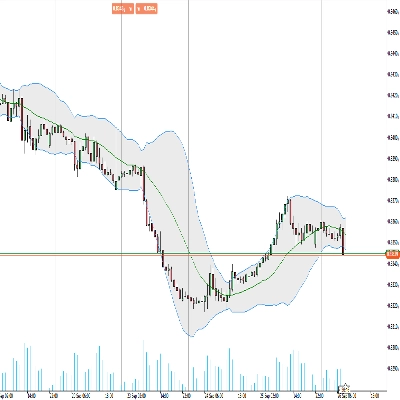
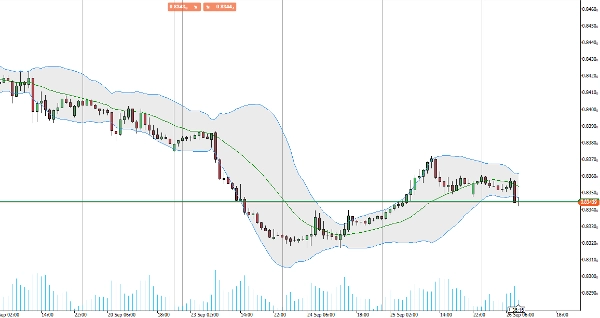
Daha net görselleştirme ile ticaret deneyiminizi yükseltmek için tasarlanmış geliştirilmiş Bollinger Bantları göstergemizi tanıtıyoruz.
Bu görsel iyileştirme, piyasa volatilitesini yorumlamayı ve potansiyel kırılma ve dönüş noktalarını belirlemeyi kolaylaştırır. Daha net içgörüler ve geliştirilmiş karar verme arayan tüccarlar için idealdir.
Daha keskin analiz ve daha iyi sonuçlar için ticaret araç setinizi bugün yükseltin.
Özet
Gösterge profili
Müşteri değerlendirmeleri
0.0
Değerlendirmeler: 0
Müşteri değerlendirmeleri
Bu ürün için henüz bir değerlendirme yok. Ürünü denediniz mi? O zaman ona dair görüşlerini paylaşan ilk kişi olun!
Tartışma
SSS
BTCUSD
Forex
Breakout
Indices
EURUSD
Commodities
GBPUSD
NZDUSD
Bollinger
Scalping
Crypto
Stocks
XAUUSD
NAS100
USDJPY
cTrader Store üzerinden erişilebilen işlem botları, göstergeler ve eklentiler gibi ürünler, üçüncü taraf sağlayıcılar tarafından sağlanır ve yalnızca bilgilendirme ve teknik erişim amaçlarıyla sunulur. cTrader Store bir broker değildir ve yatırım tavsiyesi, kişisel öneriler vermez veya gelecekteki performansı garanti etmez.

!["[Hamster-Coder] Bollinger Bands" logosu](https://cdn.ctrader.com/image/webp/21d8e5d6-fb11-4bac-b9ee-cd05c2b76804_30327)


Fiyat
Başlangıç 25/09/2024
20
Satışlar