
// ══════════════════════════════════════ ══════════════════════════════════════
// 📊 INDICATEUR EMA SUR TF (MULTI-TIMEFRAME)
// Version : 1.0.0 - Indicateur professionnel pour l'analyse multi-timeframe
// Auteur : Fury Team - Armando Brecciaroli
// Date : 5 juin 2025
// ══════════════════════════════════════════════════════════════════════════
//
// DESCRIPTION :
// ===========
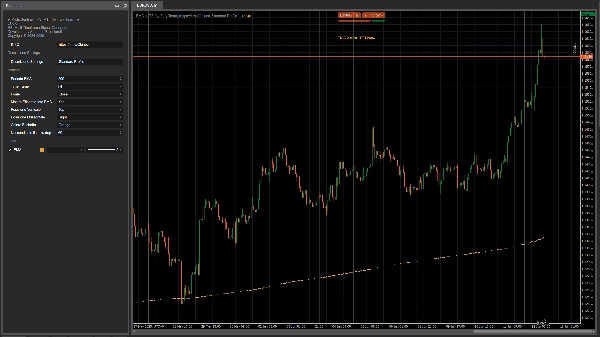
// EMA sur TF est un indicateur avancé qui affiche la moyenne mobile exponentielle
// (EMA) calculée sur une période spécifique et projetée sur la période
// actuelle du graphique. Cet outil vous permet d'utiliser des moyennes mobiles de périodes supérieures
// (par exemple H4, D1) même sur des graphiques avec des périodes inférieures (M15, H1),
// permettant une analyse multi-timeframe complète et immédiate.
//
// FONCTIONNALITÉS CLÉS :
// ==========================
// - Affichage de l'EMA de n'importe quelle période sur le graphique actuel
// - Support complet de toutes les périodes disponibles dans cTrader
// - Personnalisation complète de la période EMA et de la source de prix
// - Gestion de l'étiquette d'information avec positionnement flexible
// - Système de licence sécurisé et vérification automatique des mises à jour
// - Entièrement optimisé pour des performances élevées même sur de grands ensembles de données
// - Personnalisation complète de l'apparence visuelle (couleurs, style de ligne)
//
// USAGES PRATIQUES :
// ================
// - Identifier la tendance à long terme sur un graphique à période inférieure
// - Afficher des moyennes significatives de périodes supérieures
// - Créer des stratégies multi-timeframe basées sur les moyennes mobiles
// - Identifier des supports et résistances dynamiques plus fiables
//
// JOURNAL DES MODIFICATIONS :
// =========
// v1.0.0 (05/06/2025)
// - Première version avec support complet de toutes les périodes
// - Mise en œuvre d'un système avancé de gestion des licences
// - Interface utilisateur personnalisable avec HUD informatif
// - Ajout d'une étiquette informative sur le graphique
// - Système de mise à jour automatique intégré
// - Optimisation des performances pour les séries temporelles étendues
// - Support de toutes les sources de prix (Clôture, Ouverture, Haut, Bas, etc.)
// - Gestion automatique de l'affichage des messages système
// ═══════════════════════════════════════════════════════════════════════════════
Pour activer la licence, suivez les informations à l'écran ou dans les journaux.
5 | 0 % | |
4 | 100 % | |
3 | 0 % | |
2 | 0 % | |
1 | 0 % |


