TradingView RSI DIVERGENCE
Indicateur
Version 1.0, Aug 2025
Windows, Mac
Description
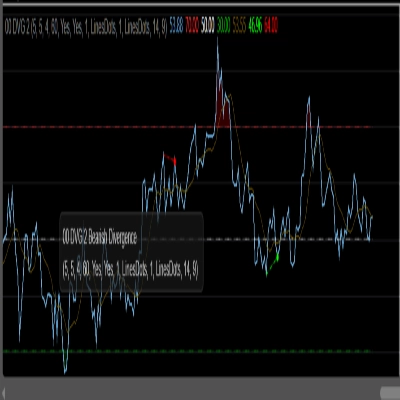
Refaire RSI, peut vous donner le même message de divergence à 99% que TV (Pas un produit TV, juste le nom)
Résumé
Profil de l'indicateur
Avis clients
0.0
Avis : 0
Avis clients
Il n'y a pas encore d'avis sur ce produit. Vous l'avez déjà essayé ? Soyez le premier à en parler aux autres !
Discussion
Questions fréquentes
Les produits disponibles sur cTrader Store, notamment les bots de trading, les indicateurs et les plug-ins, sont fournis par des développeurs tiers et mis à disposition à titre informatif et à des fins d'accès technique uniquement. cTrader Store n'est pas un courtier et ne fournit aucun conseil en investissement, aucune recommandation personnelle ni aucune garantie quant aux performances futures.


Prix
Depuis le 10/03/2025
13.63M
Volume tradé
24.17K
Pips gagnés