Trend Strength Signals St3llars33r
Chỉ báo
Phiên bản 1.0, Aug 2025
Windows, Mac
Kể từ 26/05/2025
451.48M
Khối lượng đã giao dịch
61.16K
Pip đạt được
15
Lượt bán
1.43K
Cài đặt miễn phí
Mô tả
Một bộ công cụ trực quan cho giao dịch theo xu hướng kết hợp phong bì biến động với kênh nhận biết chu kỳ để hiển thị chế độ, thời điểm và rủi ro trong nháy mắt. Nó được thiết kế để dễ đọc trên bất kỳ nền nào (sáng/tối) và giữ màn hình sạch sẽ trong khi vẫn cung cấp cho bạn các gợi ý “nên làm gì tiếp theo”.
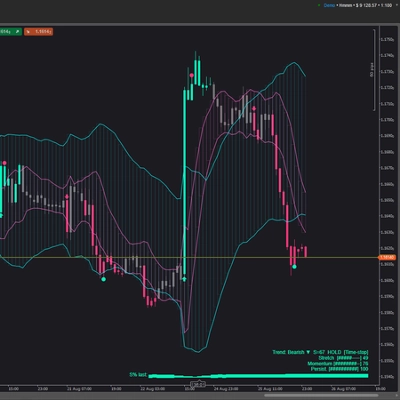
Những gì bạn thấy trên biểu đồ
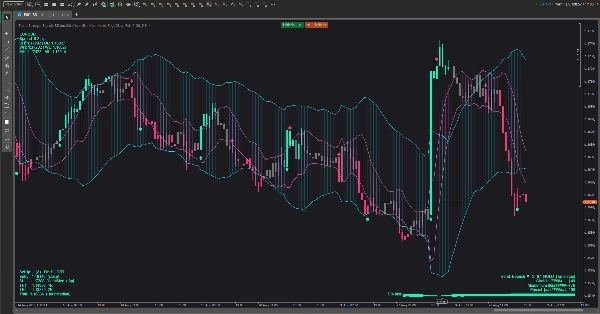
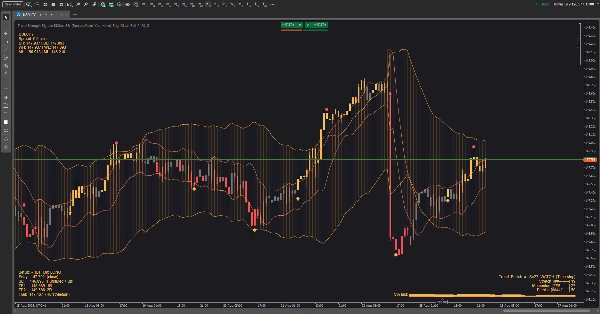
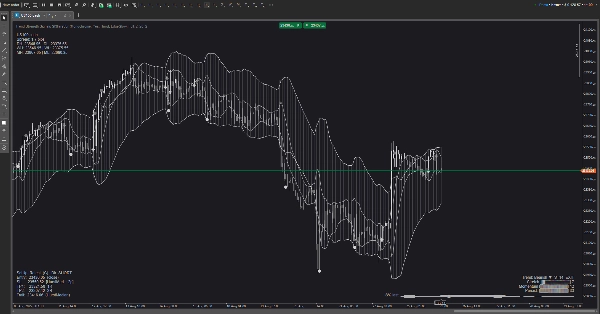
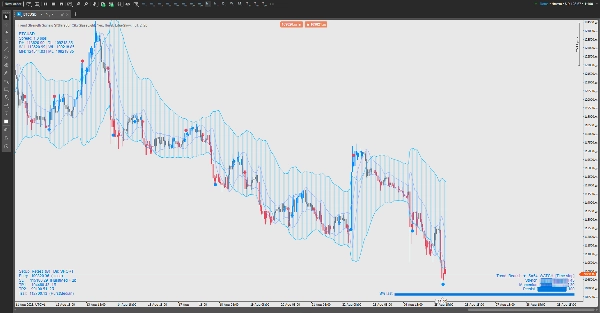
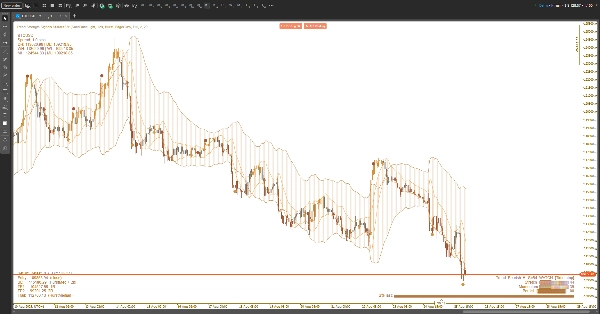
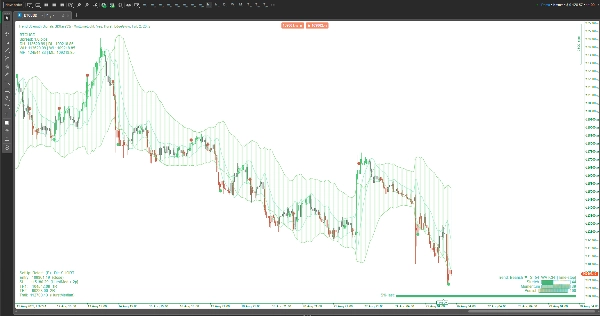
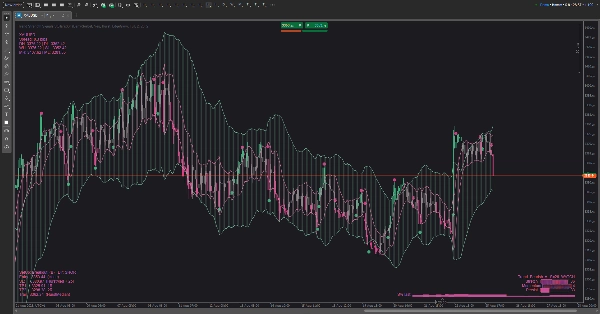
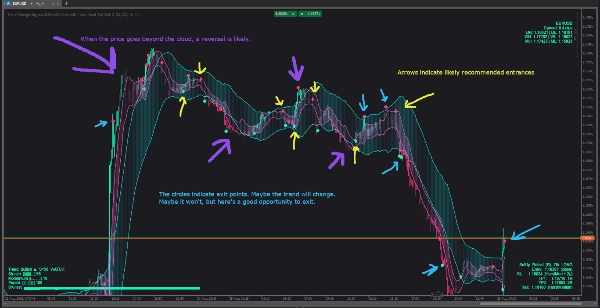
- Đám mây (có thể bật/tắt):
-
- Một biến động đám mây mở rộng/thu hẹp theo hoạt động thị trường.
- Một chu kỳ đám mây theo dõi nhịp điệu lăn của giá.
- Bạn có thể hiển thị một trong hai, cả hai hoặc không hiển thị.
- Tín hiệu: mũi tên lên/xuống không gây phiền nhiễu cho các khả năng thay đổi xu hướng; các chấm nhỏ cho các gợi ý chốt lời.
- Hiển thị sức mạnh xu hướng (Trend Strength HUD) (ba kiểu):
-
- Nhẹ — một thẻ trạng thái nhỏ gọn.
- Chuyên nghiệp — một bảng điều khiển nhỏ với ba đồng hồ đo (kéo giãn, động lượng, độ bền) cùng một biểu đồ tia lửa lịch sử nhỏ.
- Dải băng — một thanh mềm gần giá với cường độ theo sức mạnh xu hướng.
- Hiển thị rủi ro (Risk HUD): đề xuất một hướng đi, khu vực dừng bảo vệ, hai mục tiêu lợi nhuận phân lớp và một ý tưởng trailing tùy chọn. Nó nằm ở bất kỳ góc nào bạn chọn và cập nhật khi thanh giá phát triển.
- Hiển thị thị trường (Market HUD): ký hiệu & spread, cùng các tham chiếu cao-thấp ngày/tuần/tháng, để bạn luôn biết vị trí của mình trong bản đồ lớn hơn.
- Chủ đề: bộ màu được tuyển chọn cho biểu đồ sáng và tối (và chế độ Tùy chỉnh). Tất cả các yếu tố đồ họa—bao gồm HUD và tín hiệu—tuân theo chủ đề đang hoạt động.
Cách sử dụng (thực tế, không kỹ thuật)
- Chọn chế độ xem đám mây của bạn:
-
- Sử dụng đám mây biến động để thấy các pha siết chặt và mở rộng.
- Sử dụng đám mây chu kỳ để đánh giá các vòng quay “mép” so với “giữa”.
- Sử dụng cả hai nếu bạn muốn bối cảnh + thời điểm.
- Đọc sức mạnh xu hướng:
-
- Khi trạng thái tăng lên thành GIỮ, ưu tiên giao dịch theo hướng hiện tại; khi giảm xuống THEO DÕI, giảm mức độ mạo hiểm; nếu hiển thị THOÁT, tránh giao dịch mới hoặc thắt chặt rủi ro.
- Ở chế độ Chuyên nghiệp, đồng hồ đo tăng + biểu đồ tia lửa tăng = chất lượng cải thiện; đồng hồ đo giảm = quản lý giảm rủi ro.
- Định thời điểm vào lệnh với giá so với đám mây:
-
- Phá vỡ sau khi nén, vào lại sau khi điều chỉnh nhẹ về đám mây, hoặc bật lên từ mép ngoài là các mẫu cơ bản.
- Nếu một mũi tên xuất hiện sớm giữa thanh rồi biến mất, hãy chờ xác nhận đóng thanh nếu bạn thích ít tín hiệu giả hơn.
- Quản lý giao dịch với Hiển thị rủi ro:
-
- Đặt điểm dừng bảo vệ khoảng vượt qua ranh giới cấu trúc gần nhất mà HUD làm nổi bật.
- Chốt lời một phần tại TP1, để phần còn lại hướng tới TP2 hoặc theo dõi đường trailing được đề xuất.
- Nếu sức mạnh xu hướng giảm từ mạnh sang yếu, cân nhắc thoát sớm hơn.
- Bộ lọc tình huống:
-
- Tránh vào lệnh khi đám mây mỏng và lộn xộn, hoặc khi trạng thái sức mạnh ở mức THOÁT.
- Ưu tiên giao dịch khi sức mạnh đang tăng, đám mây nghiêng, và giá tương tác rõ ràng với các mép.
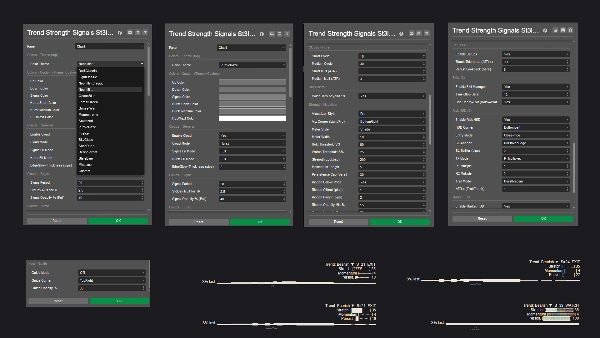
Tùy chỉnh
- Chuyển đổi góc HUD, kiểu hiển thị và chủ đề màu sắc để phù hợp với không gian làm việc của bạn.
- Chủ đề thân thiện với nền sáng giữ cho văn bản hiển thị rõ trên nền trắng; bảng màu đại dương/rừng/hoàng hôn tạo thêm độ tương phản tinh tế mà không gây chói.
Nó không phải
Đây không phải là một trình giao dịch tự động hộp đen. Nó là một công cụ hỗ trợ quyết định: nó khung chất lượng xu hướng, đề xuất vị trí rủi ro hợp lý và làm nổi bật các thời điểm xác suất cao—nhưng bạn vẫn kiểm soát.
Tóm tắt
Hồ sơ chỉ báo
Đánh giá của khách hàng
0.0
Đánh giá: 0
Đánh giá của khách hàng
Sản phẩm này chưa có đánh giá nào. Bạn đã dùng thử chưa? Hãy là người đầu tiên chia sẻ với mọi người!
Thảo luận
Câu hỏi thường gặp
Các sản phẩm có sẵn trên cTrader Store, bao gồm bot giao dịch, chỉ báo và plugin, được cung cấp bởi các nhà phát triển bên thứ ba và chỉ nhằm mục đích cung cấp thông tin và tiếp cận kỹ thuật. cTrader Store không phải là nhà môi giới và không cung cấp lời khuyên đầu tư, khuyến nghị cá nhân hay bất kỳ đảm bảo nào về hiệu suất trong tương lai.


Giá
Kể từ 26/05/2025
451.48M
Khối lượng đã giao dịch
61.16K
Pip đạt được
15
Lượt bán
1.43K
Cài đặt miễn phí