Descrição
Painel de Informações da Barra: informações instantâneas e configuráveis ao passar o mouse sobre qualquer barra
Visão geral
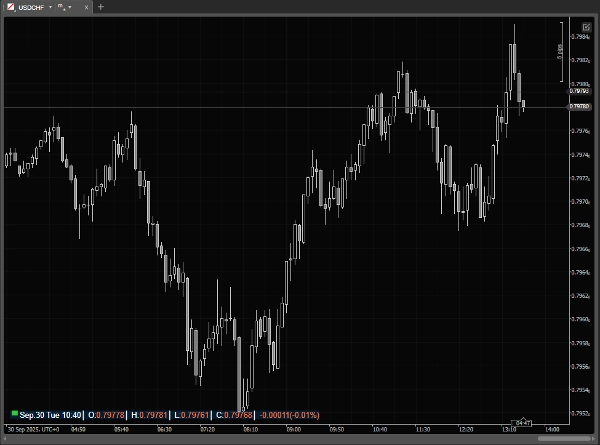
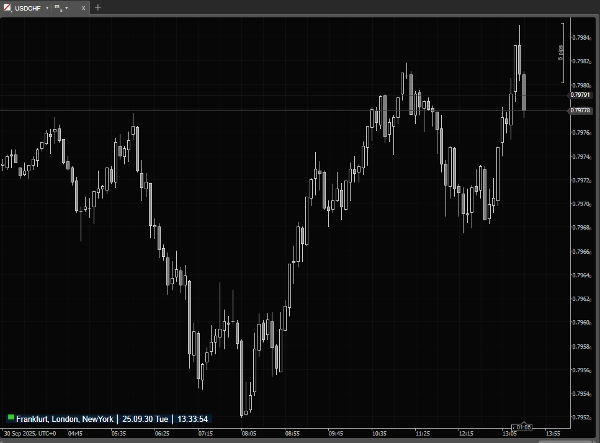
O Painel de Informações da Barra é uma sobreposição leve do cTrader que fornece informações instantâneas e precisas sobre qualquer barra no gráfico. Quando o mouse está fora do gráfico, ele mostra uma linha de status compacta com a sessão atual do mercado e o horário do servidor/local/UTC.
O cTrader já fornece informações da barra, mas apenas na barra de status da janela principal barra - o que significa que não é visível quando você usa gráficos destacados. Também não pode ser personalizado e a fonte pequena frequentemente dificulta a leitura rápida. O Painel de Informações da Barra resolve esses problemas trazendo uma sobreposição clara e totalmente personalizável diretamente no gráfico.
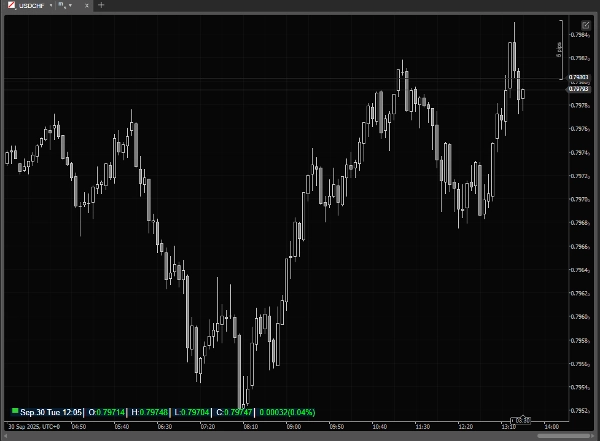
Passe o mouse sobre as barras e o painel se expande para mostrar a Data, Hora, Abertura, Máxima, Mínima, Fechamento, Volume de Ticks e (opcionalmente) a Variação Percentual em relação à barra anterior da barra destacada. Todos os elementos visuais e de layout são configuráveis para que o painel se ajuste ao seu fluxo de trabalho e tema do gráfico.
Principais características
· Indicador de sessão de mercado + carimbo de data/hora ao vivo (Local / Servidor / UTC).
· Painel ao passar o mouse que mostra da barra destacada: Data, Hora, A/M/M/F, Volume de Ticks.
· Exibição opcional da variação percentual (atual vs barra anterior).
· Dois modos de exibição: compacto (mouse fora) e detalhado (mouse sobre o gráfico).
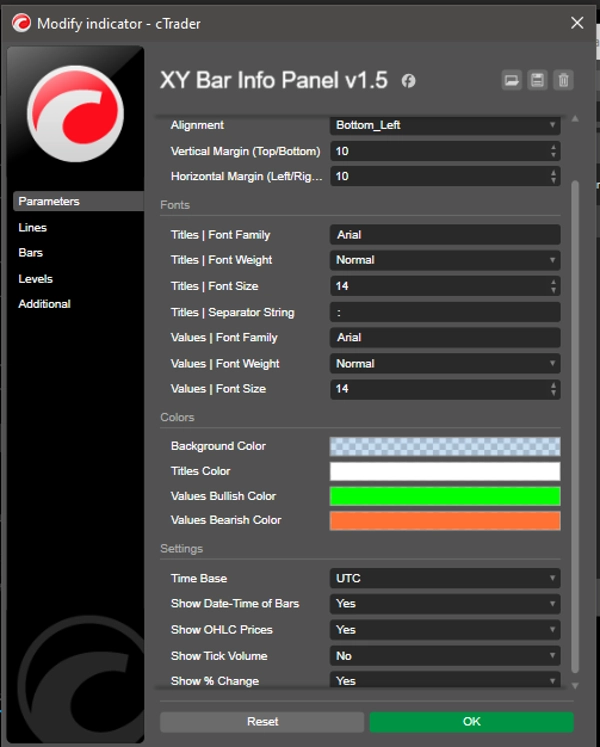
· Nove opções de posicionamento + margens em pixels para deslocamentos vertical e horizontal.
· Controles de fonte separados para títulos (rótulos) e valores (família, peso, tamanho).
· String separadora de título para rotulagem compacta.
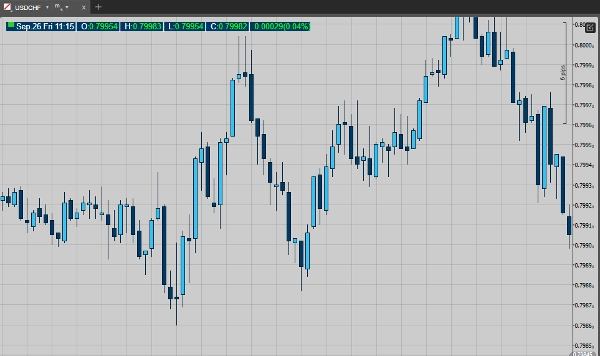
· Cores personalizáveis: fundo do painel, cor do título, cores de valor de alta (bullish) e baixa (bearish).
Casos de uso
· Leia rapidamente OHLC exato e carimbo de data/hora para qualquer barra histórica ou ao vivo sem usar a mira manual.
· Verifique o volume de ticks e a variação percentual enquanto analisa a ação do preço.
· Monitore o status da sessão de mercado e o horário do servidor/local/UTC de relance.
· Prepare capturas de tela do gráfico ou material educacional com dados de barra consistentes e legíveis.
· ...
Por que os traders vão gostar
Ao contrário da barra de status embutida do cTrader (que é fixa na parte inferior da janela principal, desaparece em gráficos destacados e usa fontes pequenas e não configuráveis), Painel de Informações da Barra está sempre visível onde você quiser, com fontes, cores e layout claros. Ele economiza tempo em comparação com a leitura manual da barra de status ou dos valores da mira, mantém seu gráfico limpo e fornece exatamente as informações que você precisa de relance. Leve e responsivo, foi projetado para uso diário sem deixar sua plataforma lenta.
Resumo
Avaliações de clientes
5 | 100 % | |
4 | 0 % | |
3 | 0 % | |
2 | 0 % | |
1 | 0 % |