
Description
Profileur de Repli de Tendance
Profileur de Repli de Tendance est un indicateur cTrader conçu pour analyser comment une tendance respire en mesurant la profondeur et la fréquence des replis – désormais aussi en pourcentage de retracement de Fibonacci.
En utilisant un filtre de tendance basé sur l'EMA, l'indicateur :
- détecte quand une claire tendance haussière ou tendance baissière est en place ;
- identifie chaque repli confirmé au sein de cette tendance ;
- mesure la profondeur du repli en pips ;
- calcule le pourcentage de retracement de type Fibonacci par rapport à la dernière jambe d'impulsion ;
- suit en temps réel :
-
- combien de replis se sont produits dans la tendance actuelle,
- la dernière profondeur de repli,
- la profondeur moyenne des replis,
- le dernier pourcentage de retracement Fibonacci.
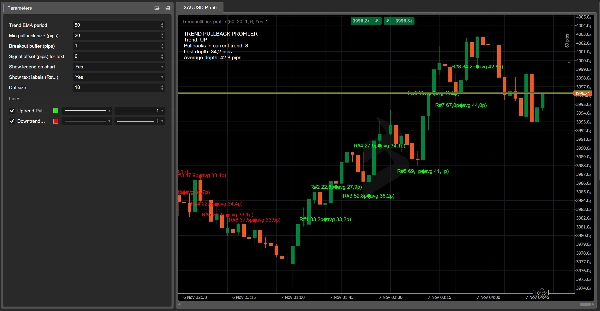
Sur le graphique, il :
- trace un grand point vert au creux du repli dans une tendance haussière,
- un grand point rouge au sommet du repli dans une tendance baissière,
- imprime optionnellement une étiquette compacte comme :
22.5 p / 38.2%.
Dans le coin supérieur gauche, une légende dynamique affiche :
- la direction actuelle de la tendance (HAUSSE / BAISSE / AUCUNE) ;
- le nombre de replis dans la tendance actuelle ;
- la dernière profondeur de repli (en pips) ;
- la profondeur moyenne des replis (en pips) ;
- le dernier pourcentage de retracement Fibonacci.
Paramètres clés
- Période EMA de tendance
Période EMA utilisée pour définir la direction de la tendance. - Taille minimale du repli (pips)
Profondeur minimale requise du repli (en pips) pour être comptée comme un retracement valide. - Marge de rupture (pips)
Distance supplémentaire que le prix doit dépasser par rapport à l'extrême précédent de la tendance pour confirmer une nouvelle jambe et clôturer le repli. - Décalage du signal (pips) pour le texte
Décalage vertical pour les étiquettes de texte par rapport au sommet/creux du repli. - Afficher la légende sur le graphique
Active ou désactive la légende sur le graphique avec la tendance, les dernières et moyennes métriques. - Afficher les étiquettes de texte près des points
Si activé, imprime une petite étiquette à côté du point avec la profondeur du repli (et optionnellement le % de Fibonacci). - Afficher le % de Fibonacci dans les étiquettes
Si activé, affiche à la fois les pips et le % de Fibonacci dans l'étiquette (XX.Xp / YY.Y%). - Taille des points
Contrôle la taille des points affichés sur le graphique, facilitant la détection des replis même sur des unités de temps inférieures.
Cas d'utilisation pratiques
- Profilage visuel de la profondeur habituelle des replis sur un symbole/unité de temps donné.
- Planification des entrées limites autour des zones de retracement typiques plutôt que sur des niveaux aléatoires.
- Détection des replis exceptionnellement profonds (par exemple, au-delà de 61,8 % ou 78,6 %) pouvant signaler l'épuisement de la tendance ou un possible retournement.
- Ajout d'informations objectives et numériques sur les replis et Fibonacci à votre manuel de trading de tendance.
Comment le retracement de Fibonacci est calculé dans Trend Pullback Profiler
Trend Pullback Profiler calcule le pourcentage de retracement de type Fibonacci basé sur la dernière jambe d'impulsion de la tendance, et non sur des hauts et bas arbitraires.
Dans une tendance haussière
- L'indicateur suit une jambe d'impulsion depuis :
-
- Prix de base de la tendance = dernier creux significatif (fin du repli précédent)
- Extrême de la tendance = dernier sommet de la tendance
- Lorsqu'un repli se forme, l'indicateur mesure :
-
- Profondeur du repli (prix) :
depthPrice = trendHigh – pullbackLow - Taille de la jambe d'impulsion :
legSize = trendHigh – trendBasePrice
- Profondeur du repli (prix) :
- Le pourcentage de retracement Fibonacci est :
Fib% = (depthPrice / legSize) * 100
Ainsi, si le prix recule d'environ 38,2 % à 50 % de la dernière impulsion avant de continuer à monter, vous verrez des valeurs proches de 38,2%, 50%, 61,8%, etc.
Dans une tendance baissière
- La jambe d'impulsion va de :
-
- Prix de base de la tendance = dernier sommet significatif (fin du repli précédent)
- Extrême de la tendance = dernier creux de la tendance
- Le repli remonte à contre-courant de la tendance, et l'indicateur mesure :
-
- Profondeur du repli (prix) :
depthPrice = pullbackHigh – trendLow - Taille de la jambe d'impulsion :
legSize = trendBasePrice – trendLow
- Profondeur du repli (prix) :
- Même formule :
Fib% = (depthPrice / legSize) * 100
Ainsi, chaque point que vous voyez sur le graphique représente un repli à l'intérieur d'une impulsion claire de la tendance actuelle, exprimé à la fois en pips et en pourcentage de Fibonacci, vous permettant de juger rapidement si un retracement est faible, typique ou exceptionnellement profond.
Résumé
Key features include:
- Detection of trend direction and pullbacks.
- Measurement of pullback depth and Fibonacci retracement percentage.
- Live tracking of the number of pullbacks, last pullback depth, average pullback depth, and last Fibonacci retracement percentage.
- Visual chart elements such as large green dots at pullback lows in uptrends and large red dots at pullback highs in downtrends.
- Optional compact labels displaying pullback depth and Fibonacci percentage.
- A dynamic legend showing current trend direction, pullback counts, and metrics.
The Fibonacci retracement is calculated based on the last impulse leg, defined by the last significant trend base and extreme prices, providing objective numeric data to assess whether retracements are shallow, typical, or unusually deep. The indicator supports various markets including Forex, indices, commodities, cryptocurrencies, and stocks. It offers configurable parameters such as EMA period, minimum pullback size, breakout buffer, and display options for labels and legend.
Avis clients
5 | 50 % | |
4 | 50 % | |
3 | 0 % | |
2 | 0 % | |
1 | 0 % |


