AbsorptionRatio_AutoRiskPanel
Wskaźnik
Wersja 1.0, Dec 2025
Windows, Mac
5.0
Opinie: 1
Opis
AbsorptionRatio_AutoRiskPanel przekształca dowolny symbol cTrader w aktywny panel ryzyka 🛰️.
Zamiast polegać na wielu ETF-ach jak oryginalny wieloaktywny Wskaźnik Współczynnika Absorpcji, ten wskaźnik tworzy proxy AR dla pojedynczego symbolu bezpośrednio na podstawie ruchu cen instrumentu, którym handlujesz:
- 📉 Oblicza logarytmiczne zwroty bieżącego symbolu.
- 🔗 Mierzy autokorelację zwrotów na kilku opóźnieniach (1…7 świec, w zależności od okresu korelacji).
- 📊 Agreguje średnią bezwzględną autokorelację i mapuje ją na znormalizowany Współczynnik Absorpcji między 0,5 a 1,0 — wyższe wartości oznaczają większą koncentrację i bardziej zwarte zachowanie.
- 🧬 Wygładza surowy sygnał za pomocą EMA, tworząc stabilną krzywą AR.
- 🧪 W trakcie ruchomego statystycznego okresu retrospekcji oblicza:
-
- średnią i odchylenie standardowe AR
- bieżący Z-Score (ile σ powyżej/poniżej średniej)
- pozycję percentylową dzisiejszego AR względem historii
- 🤖 Z włączonymi Auto Thresholds wskaźnik ciągle samokalibruje poziomy ryzyka:
-
- Niskie Ryzyko ≈
średnia − 0,5σ - Wysokie Ryzyko ≈
średnia + 0,5σ - Ekstremalne Ryzyko ≈
średnia + 1,5σ
Wartości są ograniczone do[0…1]i aktualizowane świeca po świecy, więc reżimy dostosowują się do każdego symbolu i interwału czasowego.
- Niskie Ryzyko ≈
- 🧱 Na podstawie tych progów AbsorptionRatio_AutoRiskPanel definiuje cztery dynamiczne reżimy:
-
- NISKI → rozproszony, spokojny / ryzyko włączone
- NORMALNY → zrównoważone / neutralne warunki
- WYSOKI → zwiększona koncentracja, tendencje do ryzyka wyłączonego
- EKSTREMALNY → środowisko stresowe, potencjalny skok ryzyka systemowego 🛑
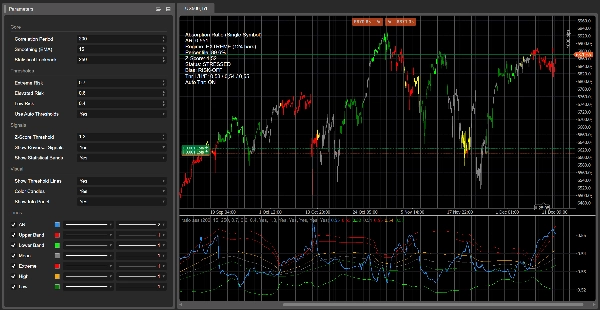
- 🕯️ Na głównym wykresie świece mogą być kodowane kolorami według ryzyka:
Daje to natychmiastowy filtr wizualny: na przykład handluj tylko wejścia w trend, gdy świece nie są czerwone/pomarańczowe lub zmniejszaj pozycję podczas stresujących reżimów. -
- 🔴 Czerwony → AR statystycznie zestresowany (Z-Score ≥ próg)
- 🟢 Limonkowy → AR statystycznie spokojny (Z-Score ≤ −próg)
- 🟧 / 🟡 Pomarańczowy/Żółty → powyżej Wysokiego / blisko Ekstremalnego
- ⚪ Szary → strefa neutralna
- 💚 Zielony → niskie AR, bardziej rozproszone / ryzyko włączone
- 🎯 Opcjonalne sygnały powrotu do średniej w panelu AR:
-
- 🟢 Strzałka kupna gdy AR jest statystycznie spokojny i zaczyna rosnąć
- 🔴 Strzałka sprzedaży gdy AR jest statystycznie zestresowany i zaczyna spadać
- 📋 Kompaktowy panel informacyjny w lewym górnym rogu wyświetla:
-
- bieżącą wartość AR
- aktywny reżim + czas trwania (świece spędzone w tym reżimie)
- Percentyl, Z-Score oraz jakościowy Status (STRESSED / CALM / NORMAL)
- skłonność do ryzyka (RISK-ON / RISK-OFF / NEUTRAL)
- efektywne progi Niskie / Wysokie / Ekstremalne używane oraz czy Auto Thresholds są WŁĄCZONE czy WYŁĄCZONE
Użyj AbsorptionRatio_AutoRiskPanel do:
- unikania handlu podczas statystycznie zestresowanych, ryzyko wyłączonych reżimów
- identyfikacji spokojnych środowisk, gdzie wybicia lub podążanie za trendem mogą działać lepiej
- kontekstualizacji każdej strategii w ramach dynamicznego systemu ryzyka zamiast używania stałych filtrów zmienności.
⚙️ Parametry (dokumentacja w magazynie)
Podstawowe ⚙️
- Okres korelacji – Długość okna autokorelacji. Kontroluje, ile historii jest używane do oszacowania Współczynnika Absorpcji. Większe wartości = płynniejszy, bardziej „makro” reżim; mniejsze wartości = szybszy, ale bardziej szumowy.
- Wygładzanie (EMA) – Okres EMA stosowany do surowego sygnału AR. Wyższe wartości wygładzają zmiany reżimu, niższe czynią wskaźnik bardziej reaktywnym.
- Statystyczny okres retrospekcji – Okres retrospekcji dla średniej AR, odchylenia standardowego, Z-Score i percentyla. Określa, jak szybko adaptuje się statystyczna baza.
Progi 🚦
- Ekstremalne Ryzyko / Podwyższone Ryzyko / Niskie Ryzyko – Ręczne progi dla reżimów AR (NISKI / NORMALNY / WYSOKI / EKSTREMALNY) używane, gdy Auto Thresholds jest WYŁĄCZONE. Gdy Auto jest WŁĄCZONE, są ignorowane w logice i widoczne tylko jako domyślne.
- Użyj Auto Thresholds – Gdy WŁĄCZONE, progi są wyprowadzane z ruchomych statystyk AR:
-
- Niskie Ryzyko = średnia − 0,5σ
- Podwyższone Ryzyko = średnia + 0,5σ
- Ekstremalne Ryzyko = średnia + 1,5σ
Sygnały 🎯
- Próg Z-Score – Minimalny bezwzględny Z-Score do klasyfikacji AR jako statystycznie ekstremalny. Steruje etykietami STRESSED/CALM, nadpisaniami świec i strzałkami powrotu do średniej.
- Pokaż sygnały odwrócenia – Włącza/wyłącza strzałki KUPNA/SPRZEDAŻY w podoknie AR.
- Pokaż pasma statystyczne – Przełącza pasma ±2σ i linię średniej wokół AR.
Wizualizacja 🎨
- Pokaż linie progowe – Pokazuje efektywne poziomy Niskie / Wysokie / Ekstremalne używane przez silnik reżimu (ręczne lub automatyczne).
- Koloruj świece – Koloruje świece cenowe według Z-Score i poziomu reżimu dla natychmiastowej wizualizacji ryzyka.
- Pokaż panel informacyjny – Wyświetla panel tekstowy w lewym górnym rogu z AR, reżimem, statystykami i skłonnością.
Podsumowanie
Profil wskaźnika
Opinie klientów
5.0
Opinie: 1
5 | 100 % | |
4 | 0 % | |
3 | 0 % | |
2 | 0 % | |
1 | 0 % |
Opinie klientów
December 20, 2025
the cleanest use is it makes weak ideas easier to leave alone, and It should stay in the support stack.
Dyskusja
Częste pytania
Signal
Indices
Commodities
GBPUSD
RSI
Bollinger
Fibonacci
Scalping
AI
XAUUSD
NAS100
MACD
BTCUSD
Forex
Breakout
EURUSD
NZDUSD
Martingale
Prop
ZigZag
Supertrend
Fair Value Gap
SMC
Crypto
Grid
Stocks
ATR
USDJPY
VWAP
Produkty dostępne za pośrednictwem cTrader Store, w tym boty handlowe, wskaźniki i wtyczki, dostarczane są przez deweloperów zewnętrznych i udostępniane wyłącznie w celach informacyjnych oraz w celu zapewnienia dostępu technicznego. cTrader Store nie jest brokerem i nie zapewnia doradztwa inwestycyjnego, nie udziela spersonalizowanych rekomendacji ani nie gwarantuje przyszłych wyników.


Cena
42.11M
Wolumen transakcji
6.13M
Zysk w pipsach
224
Sprzedaż
8.42K
Bezpłatne instalacje