Description
Trading en temps réel avec 'HAI Quantum The Game V2'
Présentation générale
Ce jeu de trading vous permet d'explorer et de pratiquer des stratégies d'investissement dans un environnement de données de marché en temps réel. Contrairement aux simulateurs qui utilisent des données fictives, 'HAI Quantum The Game' fonctionne sur les mouvements réels du marché, ce qui en fait un outil d'apprentissage exceptionnellement précis. Les joueurs peuvent trader avec autant d'instruments financiers que leur espace de travail le permet, que ce soit sur un ou plusieurs écrans, offrant une expérience entièrement adaptable.
Ajoute automatiquement le rapport risque-rendement.
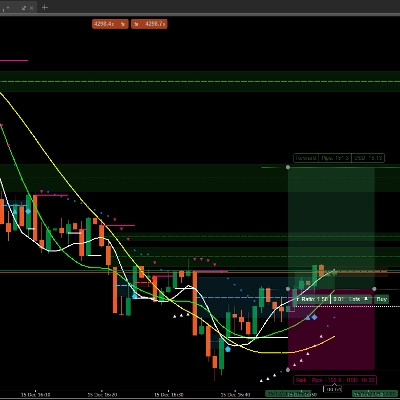
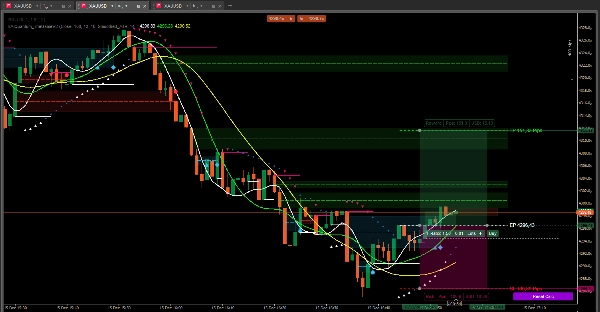
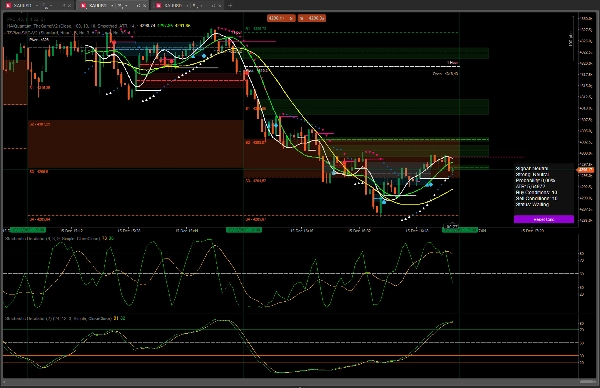
Composants de l'analyse technique
Le jeu intègre une suite d'outils d'analyse pour améliorer la précision des signaux. Ceux-ci incluent :
- Moyennes mobiles configurables : Trois moyennes mobiles que l'utilisateur peut ajuster pour identifier la direction de la tendance et les niveaux potentiels de support ou de résistance dynamique.
- Parabolic SAR (Stop and Reverse) : Un indicateur suiveur de tendance qui aide à déterminer la direction du prix et les points potentiels de retournement.
- Points pivots et boîte de gamme Fibonacci : Ces indicateurs sont ajoutés pour améliorer la fiabilité des signaux. TSPivotSMC identifient les niveaux clés de support et de résistance, tandis que Range Box Fibonacci aident à définir les zones potentielles de retournement et de continuation de tendance.
- Oscillateurs : Le jeu permet l'ajout d'indicateurs tels que le RSI (Relative Strength Index) ou le Stochastique, qui mesurent le momentum du prix et aident à identifier les conditions de surachat ou de survente.
Comment jouer
- Sélection des instruments : Choisissez et tradez les actifs (paires de devises, indices, matières premières, etc.) que vous souhaitez analyser.
- Configuration de la période : Ajustez la période pour chaque instrument individuellement ou appliquez-la à tous pour une expérience unifiée.
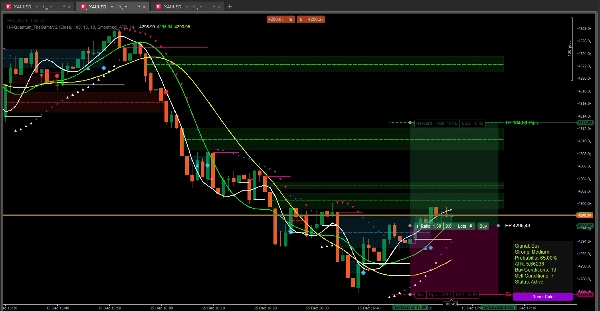
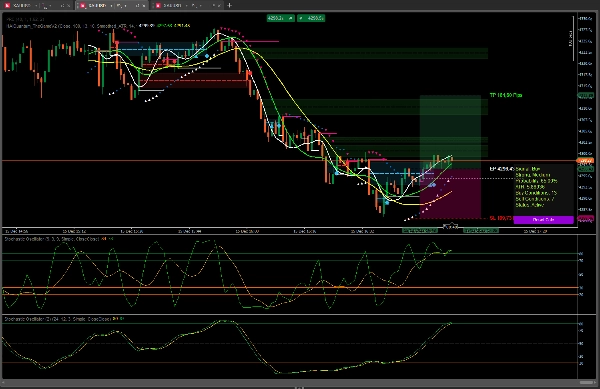
- Analyse et signaux : L'indicateur 'HAI Quantum The Game' génère des signaux d'achat ou de vente basés sur l'analyse technique réelle du marché et la confirmation des indicateurs incorporés.
- Prise de décision et gestion des risques : Une fois qu'un signal apparaît, les joueurs doivent prendre une décision éclairée. Le système propose des niveaux suggérés de Stop Loss (SL) et Take Profit (TP), mais vous pouvez définir vos propres paramètres.
- Suivi et résultats : Après l'ouverture d'une position, surveillez le mouvement réel du prix jusqu'à ce que le Stop Loss ou le Take Profit soit atteint. À la fin, les profits ou pertes sont calculés automatiquement.
Avantages du jeu
- Alternative aux cours coûteux : Ce jeu offre une opportunité unique d'apprendre à générer un revenu réel grâce au trading sans avoir à dépenser une fortune en cours théoriques.
- Réalité exceptionnelle : En opérant avec des données de marché en temps réel, vous faites face aux mêmes conditions, volatilité et schémas que vous rencontreriez dans le trading réel.
- Analyse multidimensionnelle : La combinaison d'indicateurs de tendance (moyennes mobiles, Parabolic SAR), de niveaux clés (Points pivots, Fibonacci) et d'oscillateurs (RSI, Stochastique) offre une vue complète du marché.
- Flexibilité opérationnelle : Jouez avec autant d'instruments que votre configuration d'écran le permet.
- Environnement sans risque : Apprenez le marché sans risquer de capital réel en utilisant un compte démo.
- Véritable excitation : Pour un défi plus grand, le jeu peut se connecter à un compte réel, ajoutant le facteur excitation et risque financier authentique.
https://ctrader.com/products/544?u=Thomas-Sparrow
https://ctrader.com/products/526?u=Thomas-Sparrow


![Logo de "Gaussian Channel [Iridio Capital]"](https://cdn.ctrader.com/image/webp/7c039209-5573-4a54-a072-f9528b503103_41960)
