Descripción
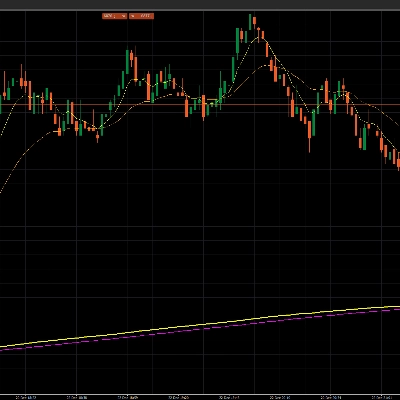
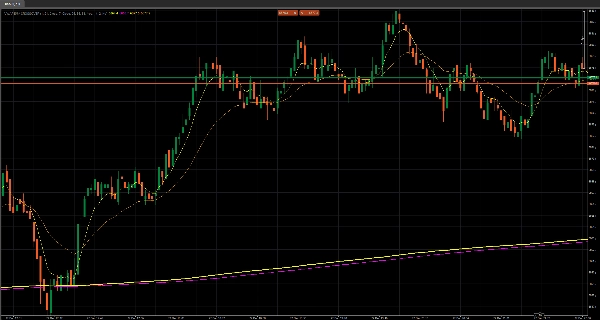
✅ VWAP (EMA) + Línea Media MVWAP — trazado directamente en el gráfico principal
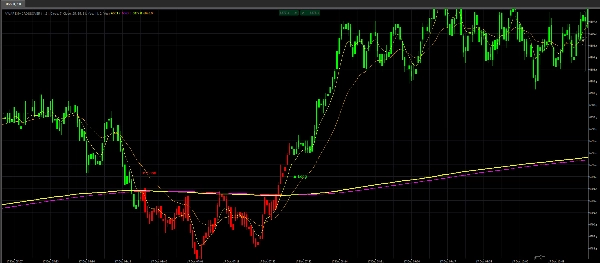
✅ Motor de Cruce Dual EMA (EMA1 + EMA2) — confirmación clara de tendencia + momentum
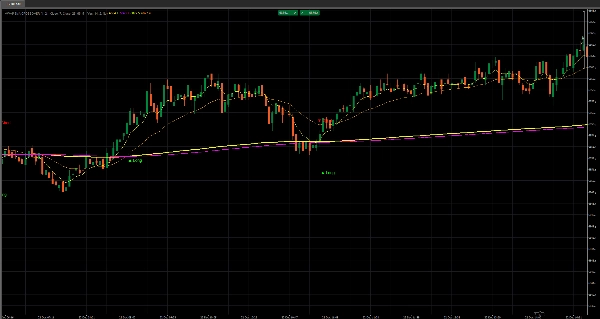
✅ Señales Instantáneas de Largo/Corto en el gráfico — etiquetas/flechas impresas en el desplazamiento exacto
✅ Velas Coloreadas (Verde/Rojo) — sesgo inmediato + visibilidad del régimen, sin dudas
✅ Reinicio Diario de VWAP por Sesión — cada día comienza con una línea base institucional limpia
✅ Desplazamiento Ajustable de Señales + Tamaño de Texto — perfectamente legible en cualquier marco temporal
✅ Diseño Limpio de Superposición — sin desorden en subventanas, todo donde se toman decisiones
Cruce VWAP / MVWAP / EMA — Superposición V2 es una herramienta rápida y directa construida para un propósito: hacer que tu sesgo y entradas sean obvios en tiempo real.
Coloca las capas de decisión más importantes directamente sobre el precio — no ocultas en paneles — para que tus ojos nunca se aparten de la acción.
La Ventaja Central: Media vs Momentum
Este indicador combina dos fuerzas poderosas:
- VWAP/MVWAP = dónde “debería” estar el precio (la media / área justa)
- Cruces EMA = cuándo se compromete el momentum (el cambio / confirmación)
Cuando ambos se alinean, no estás adivinando — estás operando una condición estructurada.
Velas Coloreadas: La Función “Sin Más Confusión”
El coloreado de las velas no es cosmético — es tu filtro de régimen en vivo.
- Velas verdes = condición alcista activa
- Velas rojas = condición bajista activa
Esto convierte tu gráfico en un sistema de semáforo: sabes instantáneamente si presionar largos, mantener la paciencia o dejar de forzar operaciones.
Para scalping y toma rápida de decisiones, esto cambia las reglas del juego: menos pensar, más ejecutar.
Señales en el gráfico: Limpias, Temporizadas, Accionables
Obtienes marcadores de Largo / Corto impresos en el gráfico en el momento en que la condición cambia.
Eso significa:
- captas el cambio temprano,
- evitas entradas tardías,
- dejas de dudar sobre lo que el gráfico “intenta decir.”
Las señales se colocan con un desplazamiento ajustable y tamaño legible, para que se mantengan limpias incluso en gráficos saturados.
Reinicio de VWAP por Sesión: Una Línea Base Nueva Cada Día
La lógica VWAP se reinicia diariamente, dándote una línea base consistente por sesión.
Eso significa que siempre lees el precio relativo a un ancla actual y significativa — no a un promedio desactualizado.
Por qué los traders mantienen esto en su gráfico
Porque ofrece tres cosas que todo gráfico necesita:
- Sesgo (velas coloreadas + línea media)
- Confirmación (cruce dual EMA)
- Temporización (disparadores instantáneos de Largo/Corto sobre el precio)
Si quieres una superposición limpia que convierta velas aleatorias en un sistema legible — esta es tu capa de ejecución plug-and-play.


![Logotipo de "High-Low Divergence [Iridio Capital]"](https://cdn.ctrader.com/image/webp/443c4661-7abb-40f1-842f-4b6ec560649b_40914)


![Logotipo de "[Stellar Strategies] Inside Bar with Signals"](https://cdn.ctrader.com/image/webp/1d9e8bfa-3b2c-4440-bb37-5856902008a7_30683)

