
**Vmm Signal Trend Pro - cTrader用インジケーター**
**一般説明**
Vmm Signal Trend Proは、cTraderプラットフォーム向けの高度なテクニカル分析インジケーターで、複数の価格パターンをリアルタイムで検出します。トレンド検出、ローソク足パターン、FVG(フェアバリューギャップ)、ギャップ、その他重要なパターンを一つの視覚的インジケーターに統合しています。
**主な特徴**
**1. トレンド検出**
- **価格アクション分析**: 過去N本のローソク足の価格アクションからトレンドを識別
- **トレンド強度**: モメンタムと構造に基づく強度のパーセンテージを計算
- **方向性アイコン**: トレンドが強い場合は緑の矢印(上向き)または赤の矢印(下向き)を表示
**2. 検出されたパターン**
**フェアバリューギャップ(FVG)**
- **強気FVG**: 現在の安値が2本前の高値より高い場合
- **弱気FVG**: 現在の高値が2本前の安値より低い場合
- **着色領域**: 半透明の長方形(緑/オレンジ)
**ギャップ**
- **上昇ギャップ**: 前の高値を上回る始値
- **下降ギャップ**: 前の安値を下回る始値
- **視覚化**: ローソク足の始値に小さな長方形を表示
**インサイドバー**
- 前のローソク足の範囲内に完全に収まるローソク足
- 方向に基づく色分け(黄色/オレンジ)
**123パターン(リバース)**
- **強気123パターン**: 上方ブレイクアウトを伴う3点
- **弱気123パターン**: 下方ブレイクアウトを伴う3点
- **シグナル**: 円形アイコン(ゴールド)
**ウィックパターン**
- **ハンマー型**: 目立つ下ヒゲ
- **シューティングスター型**: 目立つ上ヒゲ
- **アイコン**: マゼンタの星
**ピンバー**
- 長いヒゲ(実体の2倍以上)で小さな実体
- 近くの重要レベルの検出
- **アイコン**: 上/下三角形(シアン)
**包み足**
- **強気包み足**: 強気ローソク足が前の弱気ローソク足を包む
- **弱気包み足**: 弱気ローソク足が前の強気ローソク足を包む
- **アイコン**: 紫のダイヤモンド
**ドージー**
- 非常に小さな実体(デフォルトで全体のレンジの10%以下)
- 特殊タイプ:グレイブストーン、ドラゴンフライ、ロングレッグ
- **アイコン**: グレーの円
**3. サポート/レジスタンスシステム**
- スイング高値/安値の自動検出
- 重要レベルへの近接を考慮し重要度を増加
**4. インテリジェントフィルタリング**
- **タイプ別制限**: カテゴリーごとの最大シグナル数
- **時間間隔**: シグナルが近接しすぎるのを回避
- **トレンドフィルター**: 逆トレンドシグナルの許可/拒否オプション
- **最小強度**: 弱いシグナルをフィルタリング
**設定可能なパラメータ**
**基本設定**
- `Show Trend Direction`: トレンド矢印を有効化
- `Previous Bars Check`: 分析対象のローソク足本数
- `Trend Strength Threshold`: 強いトレンドとみなす最小パーセンテージ
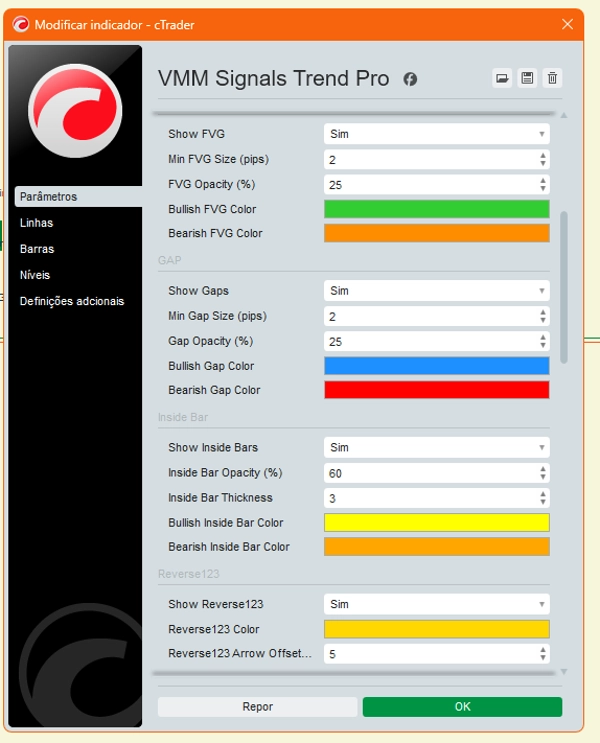
**FVG**
- `Min FVG Size`: 最小サイズ(ピップ単位)
- `Opacity`: 領域の透明度
- `Colors`: カスタマイズ可能な色
**ギャップ**
- `Min Gap Size`: 最小サイズ(ピップ単位)
- `Colors`: 上昇/下降ギャップの色
**インサイドバー**
- `Thickness`: 線の太さ
- Opacity: 透明度
- Colors: 方向別の色分け
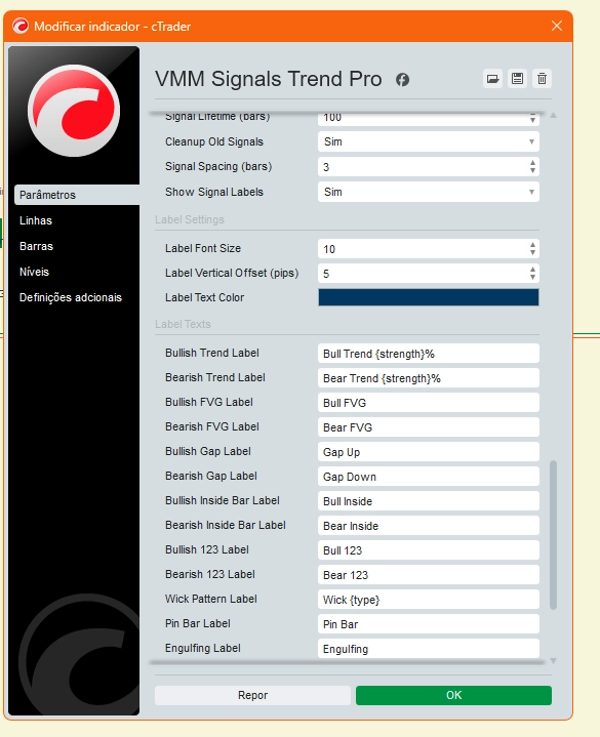
シグナル:
- シグナル寿命: シグナルの持続期間(ローソク足単位)
- シグナル間隔: シグナル間の最小間隔
- タイプ別最大シグナル数: カテゴリーごとの制限
カスタムラベル:
- カスタマイズ可能なテキスト: 各パターンに固有の設定可能なテキスト
- プレースホルダー: `%強度`用の`{strength}`、特定タイプ用の`{type}`
- 書式設定: フォントサイズ、垂直オフセット、色
- 短縮モード: 密なチャート用の省略ラベル
内部メカニズム:
1. トレンド分析:
- 線形回帰: トレンドの傾きを計算
- ローソク足カウント: 過去N期間の強気対弱気
- モメンタム: 動きの大きさを考慮
2. オブジェクト管理**
- **オブジェクトキャッシュ**: 既存シグナルの再描画を防止
- **自動クリーンアップ**: 寿命に基づき古いシグナルを削除
- **タイプ別カウンター**: 最大数量を制御
**3. **強度計算**
- 各パターンに特有の強度計算式あり
- 比率、ピップ距離、重要レベルへの近接に基づく
- 範囲: 0-100%
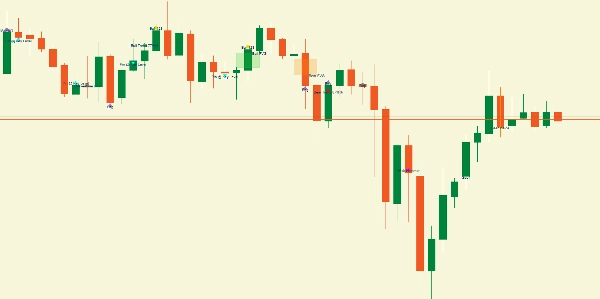
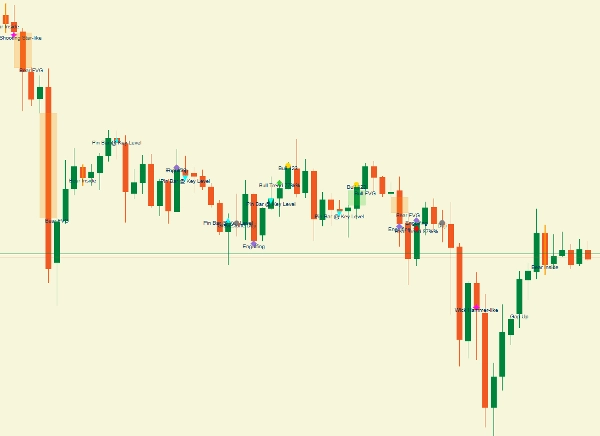
**チャート視覚化**
**チャート要素**
1. **アイコン**: 矢印、三角形、円、ダイヤモンド、星
2. **領域**: 半透明の長方形(FVG/ギャップ)
3. **線**: ハイライトされたインサイドバー
4. **ラベル**: シグナル横の説明テキスト
**カラ―コード**
- **緑**: 強気(トレンド、FVG、ギャップ)
- **赤/オレンジ**: 弱気(トレンド、FVG、ギャップ)
- **黄/オレンジ**: インサイドバー(強気/弱気)
- **ゴールド**: 123パターン
- **マゼンタ**: ウィックパターン
- **シアン**: ピンバー
- **紫**: 包み足
- **グレー**: ドージー
**利点**
**トレーダー向け**
- **オールインワン**: 複数のパターンを一つのインジケーターで表示
- **カスタマイズ可能**: 各パターンの微調整が可能
- **明確な視覚化**: 直感的なカラ―コーディング
- **フィルタリング**: シグナル過多を防止
**使用例**
**1. クイック分析**
- 現在のトレンドを特定
- 最近のFVGやギャップを確認
- 反転パターンを検出
**2. エントリー確認**
- 複数のパターンを組み合わせて確率を高める
- トレンドとの整合性を確認
- シグナル強度を考慮
**3. リスク管理**
- 近くのサポート/レジスタンスレベルを特定
- FVGを注目エリアとして利用
- シグナル間隔を考慮
**制限事項**
**依存関係**
- **変動の激しい市場**: 多くのシグナルが生成される可能性あり
- **時間足**: 時間足ごとに設定調整が必要な場合あり
- **資産**: 通貨ペアによって挙動が異なる
**考慮事項**
- **予測的ではない**: 過去のパターンは将来を保証しない
- **確認が必要**: 追加分析で常に確認すること
- **誤シグナル**: フィルターは減らすが完全には排除しない
**使用推奨**
**初期設定**
1. `Smart Filtering = true`で開始
2. スタイルに応じて`Min Signal Strength`を調整
3. 過負荷を避けるために`Signal Spacing`を使用
4. 視覚化向上のために色をカスタマイズ
**効果的な組み合わせ**
- **トレンド + FVG**: 強い整合性
- **インサイドバー + 重要レベル**: 良好なエントリーエリア
- **ピンバー + 包み足**: 反転確認
- **123 + トレンド**: 継続の可能性
**モニタリング**
- 定期的にコンソールのログを確認
- 市場に応じてパラメータを調整
- 他のインジケーターと併用
このインジケーターは、価格アクションと視覚的パターンに焦点を当てた包括的なテクニカル分析を求めるトレーダー向けの完全なツールであり、シグナルのカスタマイズとフィルタリングにおいて完全な柔軟性を提供します。
**⚠️ 重要な免責事項**
このインジケーターはテクニカル分析ツールです。生成されるシグナルはアルゴリズムに基づく提案であり、投資推奨ではありません。取引には重大な損失リスクが伴います。過去のパフォーマンスは将来の結果を保証しません。すべての取引判断はトレーダーの全責任です。適切なリスク管理を行い、実取引前にデモ口座でテストしてください。


![「Wyckoff Toolkit [Iridio Capital]」ロゴ](https://cdn.ctrader.com/image/webp/8acfe6a1-6a8e-4578-9367-9df3af2b1801_27763)


