Description
CE QUE CELA FAIT
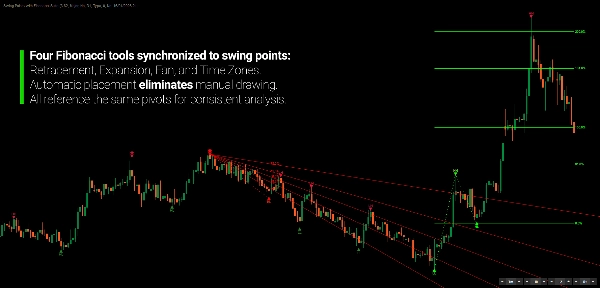
Trace automatiquement quatre outils Fibonacci à partir d'une détection unifiée des oscillations — éliminant la subjectivité et maintenant la cohérence interne entre les retracements, expansions, éventails et zones temporelles.
Le tracé manuel des Fibonacci est puissant mais subjectif. Différents traders tracent différents niveaux sur le même graphique. Les outils Fibonacci automatisés offrent généralement un seul type d'analyse — retracement OU expansion OU éventail — vous obligeant à ajouter plusieurs indicateurs ou à tracer le reste manuellement.
Cet indicateur intègre quatre outils Fibonacci en un seul système.
Les retracements, expansions, éventails et zones temporelles sont calculés automatiquement à partir de la même logique de détection des oscillations. Lorsqu'un nouveau pivot structurel se forme, les quatre outils se mettent à jour en temps réel, ancrés aux mêmes points d'oscillation. Pas de tracé manuel. Pas de variation d'interprétation. Pas de changement d'outil.
Le résultat est une analyse Fibonacci complète qui maintient une cohérence interne.
POURQUOI LE FIBONACCI AUTOMATISÉ EST IMPORTANT
L'analyse Fibonacci est largement utilisée car elle reflète la manière dont les marchés retracent et s'étendent naturellement. Le ratio d'or apparaît constamment dans la structure des prix, faisant des niveaux Fibonacci des points de référence précieux pour le support, la résistance et les objectifs de projection.
Le problème
L'analyse Fibonacci manuelle introduit trois défis pratiques :
- Subjectivité — Différents traders sélectionnent différents points d'oscillation
- Consommation de temps — Tracer quatre outils sur plusieurs périodes demande un travail important sur le graphique
- Incohérence — Retracement de l'oscillation A-B, expansion de B-C, éventail de C-D crée une analyse déconnectée
En pratique, les outils Fibonacci automatisés résolvent souvent le problème de temps, mais reposent toujours sur une logique d'oscillation déconnectée. Ils tracent automatiquement les retracements, mais vous placez encore manuellement les outils d'expansion et d'éventail à partir d'oscillations différentes.
La solution
Cet indicateur applique les quatre outils Fibonacci à un modèle d'oscillation unique et partagé. Lorsque l'algorithme identifie les points d'oscillation A, B et C :
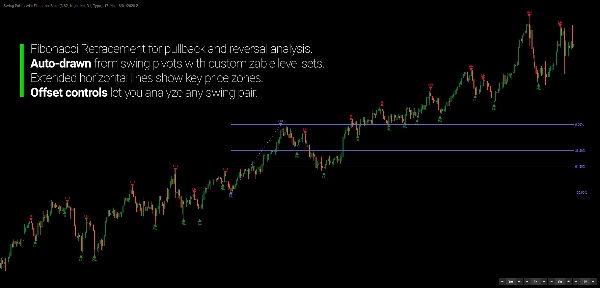
- Le retracement est tracé à partir de la paire d'oscillations la plus récente
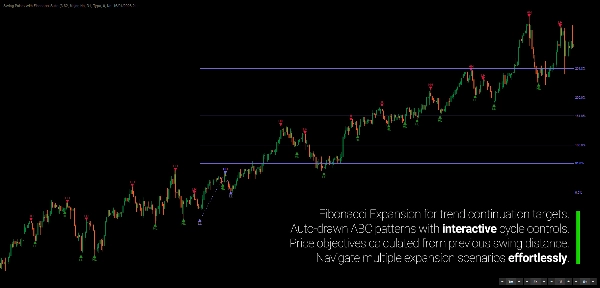
- L'expansion est projetée sur la base d'une structure à trois oscillations
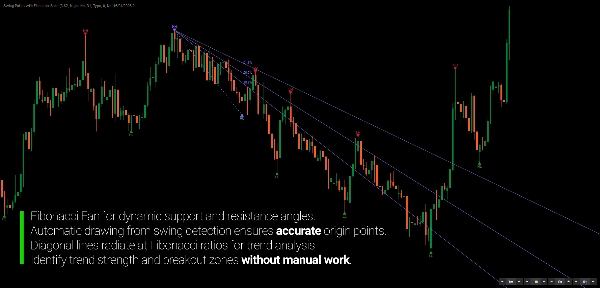
- L'éventail rayonne à partir de l'oscillation d'ancrage
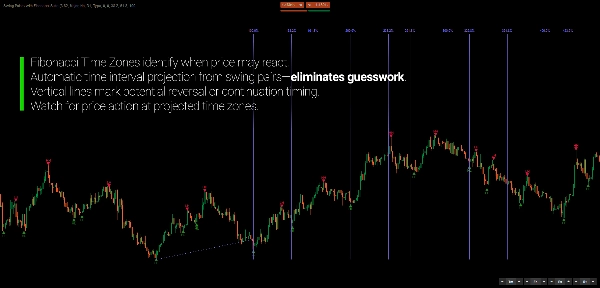
- Les zones temporelles marquent les intervalles à partir de l'oscillation de base
Chaque outil référence les mêmes pivots structurels, gardant toute l'analyse cohérente en interne à travers toutes les vues Fibonacci.
LE CONCEPT FONDAMENTAL
Détection des oscillations
L'indicateur utilise une méthode de régression pour lisser l'action des prix et identifier les points pivots structurels. Contrairement aux simples extrêmes de prix ou croisements d'indicateurs, la régression produit des pivots qui reflètent de véritables changements de tendance plutôt que la volatilité momentanée.
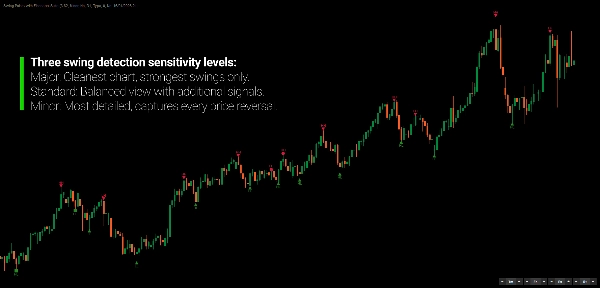
Trois modes de détection contrôlent la sensibilité :
- Majeur — Filtre le plus strict, identifie uniquement les pivots principaux de la structure du marché
- Standard — Approche équilibrée pour les périodes de swing trading
- Mineur — Inclut les oscillations contre-tendance dans des tendances plus larges pour une analyse détaillée
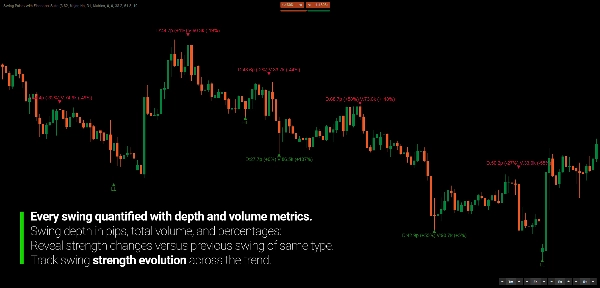
Chaque oscillation est classifiée (HH, HL, LH, LL) et éventuellement étiquetée avec des métriques : profondeur, volume, durée, efficacité, absorption et conviction. Les pourcentages comparatifs montrent comment la force actuelle de l'oscillation se rapporte aux oscillations précédentes du même type.
Intégration Fibonacci
Une fois les oscillations détectées, quatre outils Fibonacci se tracent automatiquement :
- Retracement — Niveaux horizontaux à partir de la paire d'oscillations la plus récente
- Expansion — Projections de prix basées sur la structure ABC
- Éventail — Canaux de tendance diagonaux à partir du point d'ancrage
- Zones temporelles — Projections temporelles verticales utilisant les intervalles Fibonacci
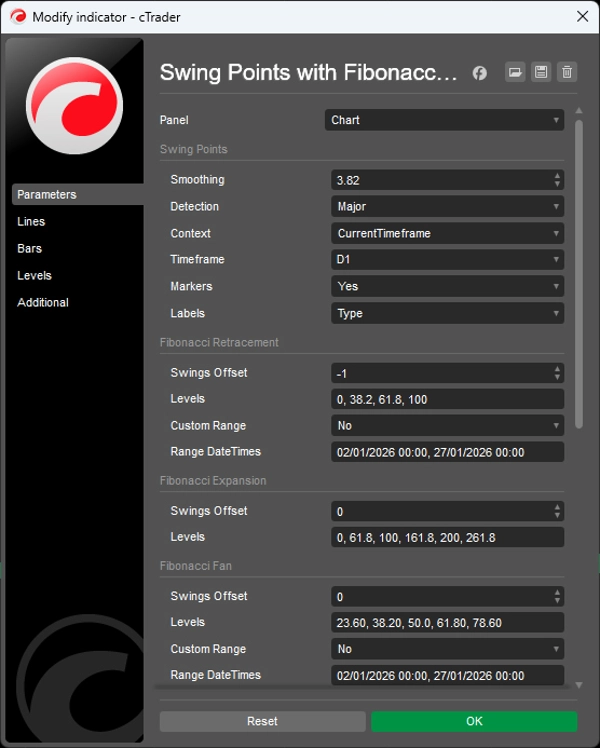
Chaque outil dispose d'un contrôle d'offset indépendant via des boutons sur le graphique. Ajustez quelle paire d'oscillations pilote chaque type d'analyse sans recalculer ni redessiner manuellement.
Les quatre outils peuvent également fonctionner en mode plage personnalisée, où vous spécifiez des heures de début/fin exactes au lieu d'utiliser les oscillations détectées — utile pour analyser des événements ou sessions de marché spécifiques.
Contexte multi-périodes
L'indicateur peut détecter les oscillations sur une période supérieure tout en s'affichant sur votre graphique actuel. Visualisez les oscillations quotidiennes et leurs niveaux Fibonacci sur un graphique H1 sans changer de période.
Cela fournit un contexte structurel des périodes supérieures directement sur les graphiques d'exécution, aidant à aligner les entrées avec la direction plus large du marché.
CARACTÉRISTIQUES CLÉS
Détection des oscillations
- Filtrage par régression pour identification des pivots structurels
- Trois modes de détection : Majeur (structure primaire), Standard (swing trading), Mineur (oscillations internes détaillées)
- Capacité multi-périodes — détecte les oscillations sur une période supérieure, affiche sur un graphique de période inférieure
- Classification des oscillations — étiquettes HH/HL/LH/LL confirment la structure de tendance
- Trois types de marqueurs — Triangle (confirmé), Cercle (état uniquement), Carré (oscillations internes)
Outils Fibonacci
- Retracement — neuf niveaux configurables (0% à 100%)
- Expansion — huit niveaux de projection (0% à 261,8%)
- Éventail — cinq canaux diagonaux (23,6% à 78,6%)
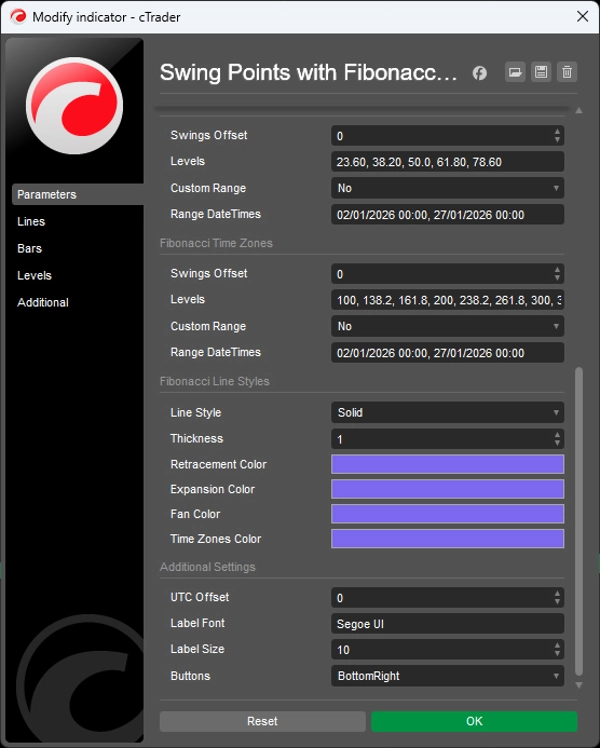
- Zones temporelles — neuf intervalles temporels (100% à 322,8%)
- Contrôles d'offset indépendants pour chaque outil via des boutons UI sur le graphique
- Mode plage personnalisée — remplace la détection d'oscillation par des plages de dates manuelles
Métriques des oscillations
- Métriques de base — Profondeur (pips), Volume (volume tick), Durée (barres)
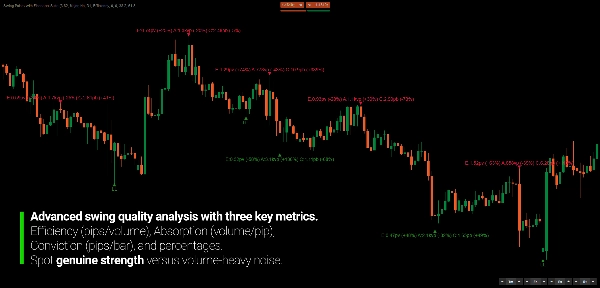
- Ratios d'efficacité — Efficacité (pips par volume), Absorption (volume par pip), Conviction (pips par barre)
- Analyse comparative — changement en pourcentage par rapport à l'oscillation précédente du même type
À QUI CELA S'ADRESSE
Cet indicateur est conçu pour les traders qui utilisent Fibonacci comme référence structurelle plutôt que comme signal autonome.
Si vous tracez régulièrement des retracements, extensions ou zones temporelles Fibonacci, cet outil systématise ce processus. Au lieu de placer manuellement plusieurs outils sur différentes oscillations, l'indicateur maintient les quatre simultanément à partir des mêmes points de référence structurels.
Il convient bien aux traders swing et position qui analysent plusieurs périodes et veulent voir la structure des périodes supérieures sur les graphiques d'exécution. Les traders focalisés sur Fibonacci bénéficieront d'avoir retracement, expansion, éventail et analyse temporelle unifiés dans un cadre unique.
Les analystes multi-périodes peuvent afficher les oscillations quotidiennes ou hebdomadaires sur des graphiques intrajournaliers sans changer de fenêtre, tandis que les analystes techniques accèdent aux métriques d'oscillation (efficacité, absorption, conviction) nécessitant normalement un calcul manuel.
Ce n'est pas un système de signal d'entrée. C'est un cadre structurel pour interpréter Fibonacci dans le contexte du marché — réduisant la charge de travail manuelle tout en maintenant la profondeur analytique qui rend les outils Fibonacci précieux.
CE QUI LE REND DIFFÉRENT
Appliquer plusieurs outils Fibonacci signifie généralement travailler avec plusieurs interprétations d'oscillations. Sans référence structurelle unifiée, combiner retracements, expansions, éventails et projections temporelles peut aboutir à des perspectives déconnectées plutôt qu'à un cadre cohérent.
Cet indicateur unifie les quatre outils sous un seul algorithme de détection des oscillations. Chaque vue Fibonacci est construite sur les mêmes pivots structurels, garantissant que différentes projections reflètent le même contexte de marché sous-jacent.
L'approche par régression filtre la volatilité à court terme tout en préservant la pertinence structurelle. Le mode majeur identifie uniquement les pivots principaux du marché. Le mode mineur révèle la structure détaillée contre-tendance dans les oscillations plus larges. Même algorithme, sensibilité différente.
La capacité multi-périodes apporte le contexte des périodes supérieures aux graphiques d'exécution sans changer de graphique. Voyez les oscillations quotidiennes et leur analyse Fibonacci complète sur un graphique H1 — contexte structurel à votre période de trading.
Les contrôles d'offset indépendants permettent une analyse simultanée de plusieurs structures d'oscillations. Retracement à partir de l'oscillation la plus récente tandis que l'expansion projette à partir de la configuration précédente. Tout est contrôlé via des boutons sur le graphique sans ajustements dans le panneau des paramètres.
---
COMPRENDRE FIBONACCI DANS LA STRUCTURE DU MARCHÉ
Les ratios Fibonacci apparaissent dans de nombreux systèmes naturels, y compris les marchés financiers. La tendance des retracements à s'arrêter près des niveaux 38,2%, 50% ou 61,8%, et des extensions à atteindre les projections 127,2% ou 161,8%, reflète une géométrie de marché sous-jacente plutôt que des propriétés mystiques.
Ces niveaux deviennent en quelque sorte auto-réalisateurs — suffisamment de traders les surveillent pour influencer le flux des ordres — mais leur persistance à travers les périodes et les instruments suggère quelque chose de plus structurel.
D'un point de vue pratique, les niveaux Fibonacci fournissent des points de référence objectifs dans une analyse graphique autrement subjective. Plutôt que de deviner où le support pourrait se former lors d'un repli, le retracement Fibonacci vous donne des zones de prix spécifiques à surveiller.
Le défi n'est pas de savoir si Fibonacci fonctionne — c'est de maintenir la cohérence dans son application. L'analyse manuelle introduit de la variance : de quelle oscillation mesurez-vous ? Utilisez-vous les mèches ou les clôtures ? Comment gérez-vous les retracements qui se chevauchent de plusieurs paires d'oscillations ?
L'application systématique élimine ces questions. L'algorithme sélectionne les oscillations selon les mêmes critères à chaque fois. Les quatre outils référencent les mêmes pivots. L'analyse devient reproductible et comparable à travers différentes conditions de marché.
Cela n'élimine pas la discrétion — vous décidez toujours quelle offset d'oscillation analyser, quels niveaux sont importants pour votre configuration, et comment interpréter la confluence entre les outils. Mais cela établit une base cohérente pour cette discrétion.
---
Le trading comporte des risques. Cet indicateur est un outil d'analyse technique — appliquez toujours une gestion appropriée des risques.


![Logo de "Smart Money Concepts (SMC) [Iridio Capital]"](https://cdn.ctrader.com/image/webp/28b69fd1-ef54-4bed-9487-07e78e883be4_40934)


