Description
Aperçu
Swing Flow est un indicateur avancé de suivi de tendance qui s'affiche directement sur le graphique des prix, vous offrant un signal visuel clair et intuitif — similaire au style du classique SuperTrend — mais reposant sur une logique sous-jacente fondamentalement différente et plus sophistiquée.
Alors que les indicateurs de tendance standard réagissent à chaque bougie, Swing Flow ancre ses calculs sur des points de retournement significatifs du marché, produisant une ligne qui reflète véritablement la tendance dominante avec beaucoup moins de bruit et de faux signaux.
Comment ça fonctionne (sans révéler la formule)
Swing Flow identifie des plus hauts et plus bas pivots significatifs sur le marché — les points de retournement naturels où le prix a réellement inversé sa direction. Il construit ensuite un niveau médian dynamique et deux bandes adaptatives (supérieure et inférieure) autour de ces pivots, appliquant un lissage ajusté à la volatilité pour filtrer les fluctuations à court terme.
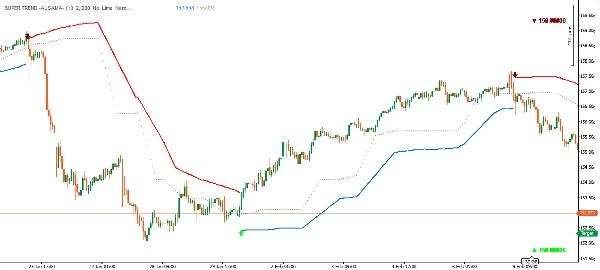
Le résultat est une ligne de tendance unique affichée sur le graphique :
- 🟢 Ligne verte sous le prix → Tendance haussière (agit comme un support dynamique)
- 🔴 Ligne rouge au-dessus du prix → Tendance baissière (agit comme une résistance dynamique)
Lorsque la tendance s'inverse, la ligne change de côté et de couleur — exactement comme SuperTrend — ce qui la rend immédiatement évidente et exploitable.
Composants de l'indicateur
Description des composants
Ligne de tendance principale
La ligne de signal principale — verte sous le prix en tendance haussière, rouge au-dessus en tendance baissière
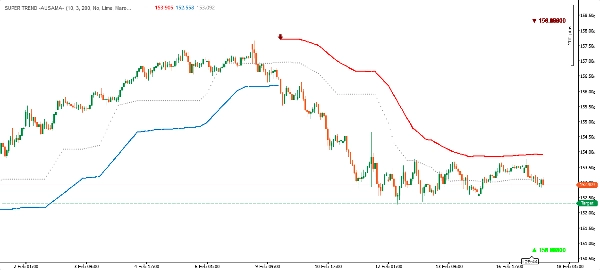
Bande supérieure
Niveau de résistance dynamique, affiché pendant les phases baissières
Bande inférieure
Niveau de support dynamique, affiché pendant les phases haussières
Ligne médiane
La ligne centrale adaptative dérivée de la structure du marché
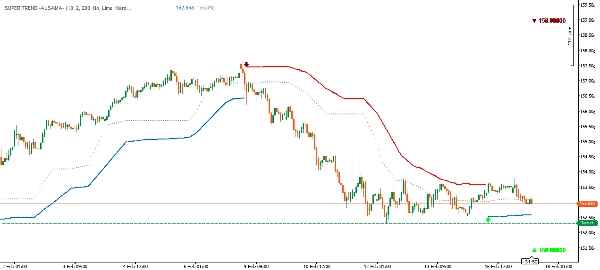
Marqueurs de signal
Flèches haut/bas avec étiquettes de prix à chaque inversion de tendance
Étiquettes de pivot (optionnel)
Marqueurs en forme de losange aux plus hauts et plus bas de swing (peuvent être activés/désactivés)
Principaux avantages
✅ Logique basée sur la structure
Contrairement à la plupart des indicateurs de tendance qui ne regardent que l'action récente des prix, Swing Flow est construit sur des points pivots de swing réels — les niveaux que le marché lui-même a déjà validés comme significatifs. Cela rend le signal de tendance fondamentalement plus pertinent.
✅ Filtre de volatilité adaptatif
Les bandes s'ajustent automatiquement à la volatilité actuelle du marché, se resserrant en conditions calmes et s'élargissant pendant les périodes volatiles. Cela réduit les faux signaux sans nécessiter de réglage manuel.
✅ Affichage clair de style SuperTrend
Malgré sa logique avancée, le rendu visuel est clair et familier. Une seule ligne sur le graphique — verte en dessous, rouge au-dessus. Pas d'encombrement. Immédiatement lisible sur n'importe quelle unité de temps.
✅ Signaux d'entrée précis
Chaque changement de tendance est marqué par une flèche directionnelle et le prix de clôture exact à la barre de retournement, vous donnant un point de référence clair pour les entrées.
✅ Personnalisation complète des couleurs
Les couleurs haussières et baissières sont entièrement personnalisables pour correspondre à votre style de graphique ou à vos préférences personnelles.
✅ Fonctionne sur tous les marchés et unités de temps
Forex, indices, matières premières, crypto — l'indicateur s'adapte naturellement à tout instrument et unité de temps grâce à son design conscient de la volatilité.
Comment l'utiliser
Suivi de tendance : Suivez la tendance dans la direction de la ligne — achetez lorsque la ligne est verte (sous le prix), vendez ou restez en dehors lorsque la ligne est rouge (au-dessus du prix).
Support et résistance dynamiques : La bande active sert de niveau de support (haussier) ou de résistance (baissier) en temps réel. Le retour du prix vers la ligne sans la casser est un signal de continuation.
Signaux d'entrée : Les marqueurs fléchés (▲ / ▼) indiquent un changement de tendance confirmé. Ils peuvent être utilisés comme déclencheurs d'entrée, surtout lorsqu'ils sont alignés avec d'autres confluences sur votre graphique.
Référence pivot (optionnel) : Activez "High & Lows" pour afficher les points pivots de swing utilisés en interne par l'indicateur. Utile pour comprendre la structure du marché en un coup d'œil.
Swing Flow vs. SuperTrend standard
CaractéristiqueSuperTrend standardSwing Flow
Base de calcul
Chaque bougie
Pivots de swing validés du marché
Bruit du signal
Plus élevé — réagit à chaque barre
Plus faible — ancré à la structure
Faux signaux
Plus fréquents sur les marchés agités
Significativement réduits
Adaptabilité
Multiplicateur ATR fixe
Bandes lissées selon la volatilité
Style visuel
Ligne unique
Ligne unique + bandes + niveau médian
Confirmation d'entrée
Changement de couleur
Flèche + étiquette de prix au retournement
Visibilité des pivots
Aucune
Marqueurs de pivots optionnels
En résumé : Swing Flow ressemble à SuperTrend, mais pense comme un trader d'action de prix.
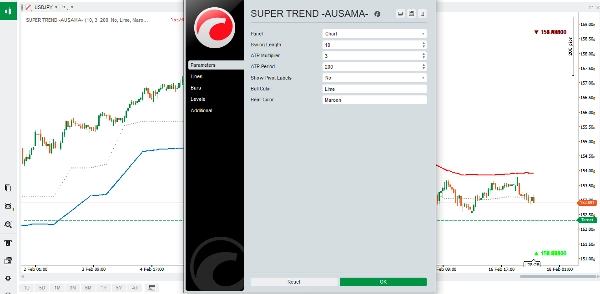
Paramètres d'entrée
ParamètreDéfautDescription
Longueur du swing
10
Contrôle la sensibilité de détection des pivots
Multiplicateur ATR
2.0
Largeur de la bande relative à la volatilité
Période ATR
200
Période de référence pour la mesure de la volatilité
Afficher les étiquettes de pivot
Désactivé
Active/désactive les marqueurs de plus hauts/bas de swing sur le graphique
Couleur haussière
Citron vert
Couleur pour la tendance haussière
Couleur baissière
Marron foncé
Couleur pour la tendance baissière
Conseils pour de meilleurs résultats
- Longueur de swing plus courte (5–8) : Plus sensible, plus de signaux — convient au scalping ou au trading actif.
- Longueur de swing plus longue (14–20) : Moins de signaux, mais de meilleure qualité — convient au swing trading ou au trading de position.
- Augmentez le multiplicateur ATR sur les marchés très volatils (par exemple, crypto) pour éviter les inversions fausses.
- Diminuez le multiplicateur ATR sur les marchés stables et en tendance pour des signaux plus serrés.
- À utiliser de préférence avec confirmation de tendance provenant d'unités de temps supérieures.
Swing Flow — Là où la structure du marché rencontre la clarté de la tendance.