
Description
Cet indicateur identifie les zones de liquidité et les blocs d'ordres sur le marché, en suivant les concepts de la Smart Money Market Theory (ICT/SMC).
https://ctrader.com/pt/products/1560
https://ctrader.com/pt/products/1386
L'indicateur fonctionne en quatre étapes principales :
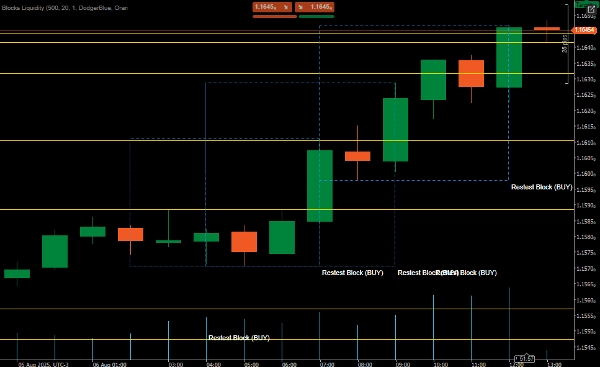
✅Identification des blocs d'ordres
Détecte les mouvements impulsifs (minimum 20 pips par défaut)
Trouve les zones de consolidation avant l'impulsion
Classe en bloc d'achat ou de vente
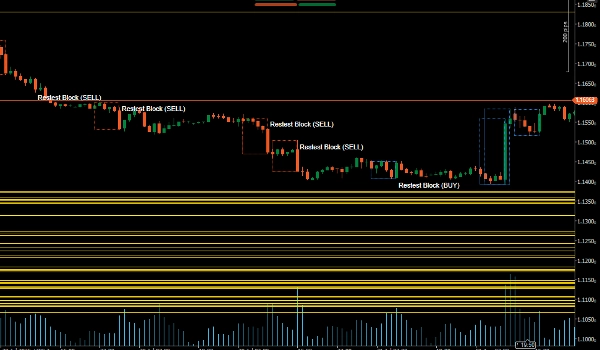
✅Identification des pools de liquidité
Marque les plus hauts et plus bas récents comme zones de liquidité
Ces zones représentent des cibles potentielles ou des points d'arrêt
✅Confirmation du retest
Vérifie lorsque le prix revient aux blocs d'ordres
Confirme avec des modèles de retournement (Pin Bar/Englobant) et le volume
✅Visualisation sur le graphique
Dessine les blocs d'ordres et les zones de liquidité
Émet des alertes sonores lors de la confirmation
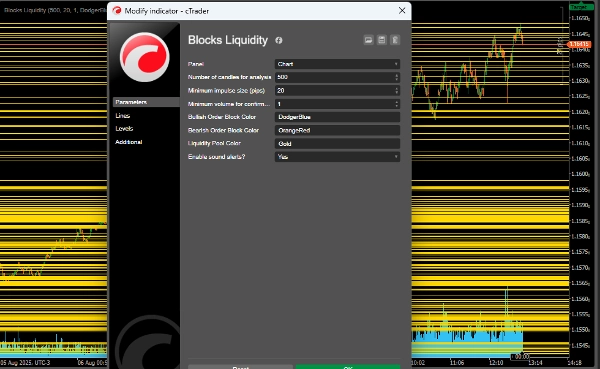
✅Paramètres configurables
LookbackPeriod : Nombre de chandeliers à analyser (500 par défaut)
MinImpulsePips : Taille minimale du mouvement impulsif (20 pips)
MinVolumeThreshold : Volume minimum pour la confirmation (1.0)
Couleurs personnalisables pour les blocs haussiers/baissiers et les zones de liquidité
Option d'alerte sonore
✅Logique de trading
Blocs haussiers (achat) :
Formés après consolidation et momentum à la hausse
Zone de support potentielle
Entrée confirmée par un modèle de retournement + volume lors du retest
Blocs baissiers (vente) :
Formés après consolidation et momentum à la baisse
Zone de résistance potentielle
Entrée confirmée de la même manière
✅Pools de liquidité :
Plus hauts/bas récents comme cibles ou stops
Zones où il y a probablement une concentration d'ordres stop
Résumé
Key features include:
- Order Block Identification: Detects bullish and bearish blocks formed after consolidation and momentum shifts, serving as potential support or resistance zones.
- Liquidity Pool Identification: Highlights recent highs and lows that may act as targets or stop areas due to stop order concentration.
- Retest Confirmation: Validates entries by checking price returns to order blocks combined with reversal candlestick patterns (Pin Bar, Engulfing) and volume thresholds.
- Chart Visualization: Draws order blocks and liquidity zones with customizable colors and provides sound alerts upon confirmation.
- Configurable parameters such as lookback period, minimum impulse size, and volume threshold allow adaptation to different trading preferences.
This indicator supports analysis of price action dynamics to assist traders in identifying key market levels and potential trade entry points.
Avis clients
5 | 100 % | |
4 | 0 % | |
3 | 0 % | |
2 | 0 % | |
1 | 0 % |


![Logo de "High-Low Divergence [Iridio Capital]"](https://cdn.ctrader.com/image/webp/443c4661-7abb-40f1-842f-4b6ec560649b_40914)


