Description
🚀 Transformez votre graphique en un centre de décision stratégique
Smart Tech Analysis n'est pas qu'un indicateur.
C'est un tableau de bord d'analyse intelligent complet, développé pour les traders qui veulent clarté, précision et agilité dans la prise de décision.
Alors que la plupart des indicateurs fournissent uniquement des informations isolées, Smart Tech Analysis intègre :
✔ Tendance
✔ Volume
✔ Fibonacci
✔ Support et Résistance
✔ Signaux techniques
✔ Recommandations opérationnelles
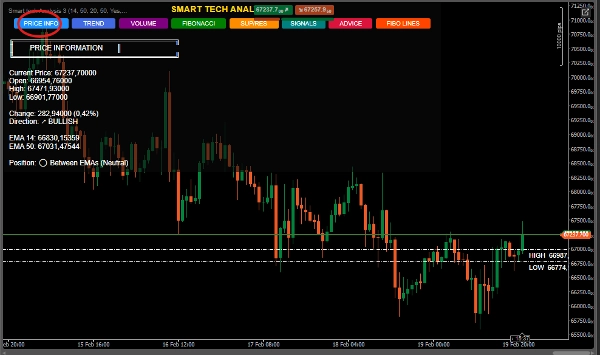
✔ Informations détaillées sur les prix
Tout cela dans un seul tableau de bord dynamique et interactif.
🔥 LA GRANDE DIFFÉRENCE
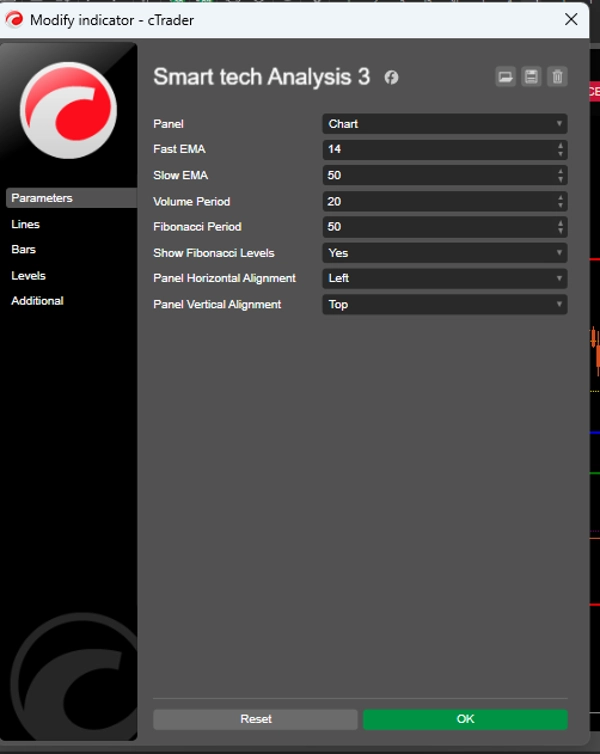
🎯 1. Système 6-en-1 – Analyse intégrée
Vous n'avez plus besoin de passer d'un indicateur à un autre.
Smart Tech Analysis combine :
📈 EMAs rapides et lentes (14 et 50)
📊 Volume avec analyse comparative
🧩 Fibonacci automatique
🛡 Support et résistance dynamiques
🚦 Génération intelligente de signaux
📌 Recommandations avec stop et objectif calculés
👉 Cela réduit le bruit visuel et augmente l'objectivité.
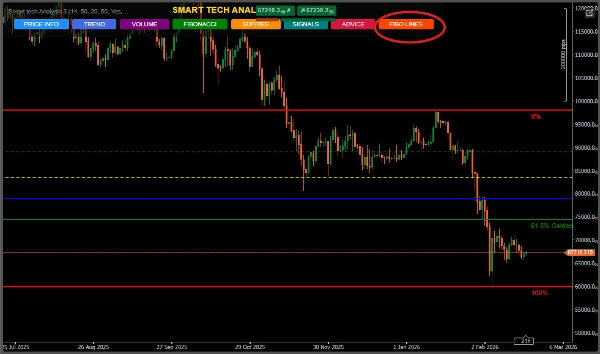
🧠 2. Panneau interactif exclusif
Interface professionnelle avec boutons intelligents :
INFOS PRIX
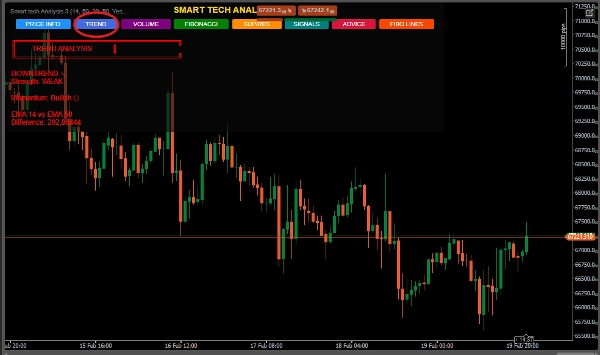
TENDANCE
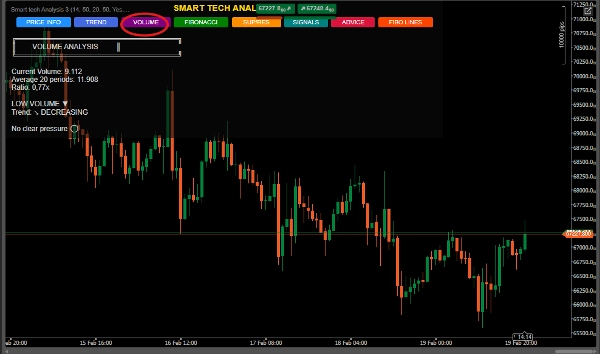
VOLUME
FIBONACCI
SUP/RÉS
SIGNAUX
CONSEILS
Le trader choisit exactement ce qu'il veut voir.
📌 Organisation.
📌 Contrôle.
📌 Professionnalisme.
📈 3. Analyse de tendance avec force et momentum
Il ne montre pas seulement si ça monte ou descend.
Il calcule :
L'intensité de la tendance
La force en pourcentage entre les EMAs
Classification : Faible, Modérée ou Forte
Cela évite les entrées faibles dans les marchés latéraux.
📊 4. Volume avec lecture institutionnelle
Le système identifie :
Volume extrême
Pression d'achat ou de vente
Accélération ou décélération
Comparaison avec la moyenne historique
👉 Idéal pour détecter une possible activité institutionnelle.
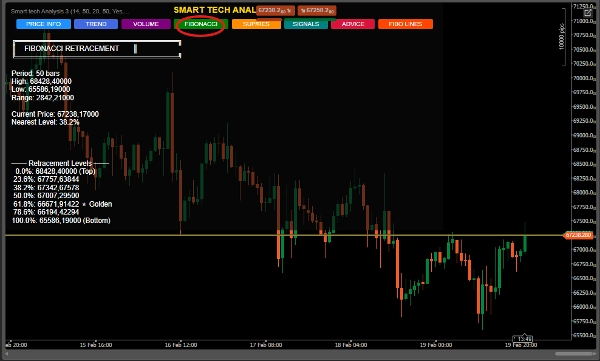
🧩 5. Fibonacci automatique avec zone dorée
Calculé dynamiquement sur la période définie.
Mise en avant spéciale pour :
⭐ Zone 61,8 % (zone dorée)
📌 Identification du niveau le plus proche
📌 Extensions haussières et baissières
📌 Recommandation contextuelle automatique
Parfait pour les traders de retracement et les swing traders.
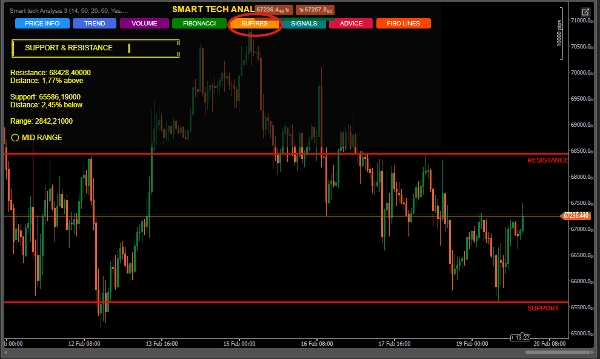
🛡 6. Support & Résistance intelligents
Détecte les hauts et bas pertinents
Montre la distance en pourcentage par rapport au prix actuel
Classe la position : Près du support, de la résistance ou en milieu de gamme
Trace des lignes automatiques sur le graphique
Idéal pour entrer dans des zones stratégiques.
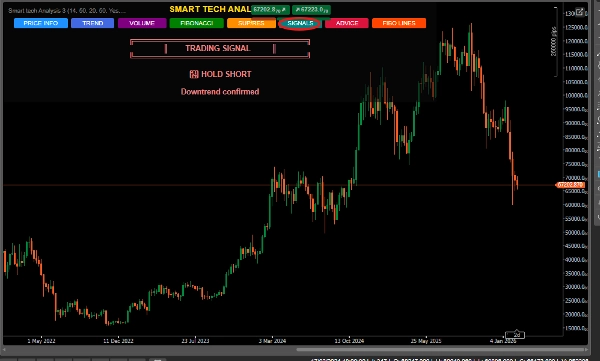
🚦 7. Système de signaux de confluence
L'algorithme ne génère pas de signaux aléatoires.
Il combine :
✔ Croisement EMA
✔ Proximité du support/résistance
✔ Structure de tendance
✔ Contexte de prix
Classification :
🟢 ACHAT FORT
🔴 VENTE FORTE
📈 TENIR LONG
📉 TENIR COURT
⏸ ATTENDRE
Avec le niveau de confiance indiqué.
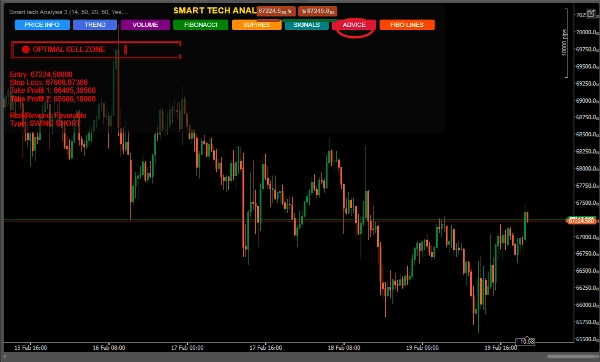
🎯 8. Recommandations avec gestion des risques
Le panneau "CONSEILS" fournit :
Entrée suggérée
Stop Loss technique
Deux objectifs de Take Profit
Structure de swing (Long ou Court)
Contexte d'opération
👉 Ce n'est pas juste une analyse.
👉 C'est un plan structuré.
🏆 Pour qui est cet indicateur ?
✔ Traders débutants qui ont besoin de clarté
✔ Traders intermédiaires qui veulent de la confluence
✔ Traders avancés cherchant l'efficacité
✔ Swing traders
✔ Scalpers utilisant la confirmation structurelle
💎 Pourquoi se démarque-t-il sur le marché ? Indicateurs courants Smart Tech Analysis
Informations isolées Analyse intégrée Pollution visuelle Tableau organisé Pas de contexte Confluence technique Pas de gestion Stop et objectif suggérés Signaux simples Signaux avec confirmation
📊 Avantages directs
✔ Réduit les décisions émotionnelles
✔ Augmente la précision
✔ Améliore la lecture structurelle
✔ Gagne du temps
✔ Élévation du niveau professionnel du trader
🧠 Positionnement sur le marché
Smart Tech Analysis est idéal pour :
Marché Forex
Indices
Matières premières
Cryptomonnaies


![Logo de "[Hamster-Coder] Bollinger Bands"](https://cdn.ctrader.com/image/webp/21d8e5d6-fb11-4bac-b9ee-cd05c2b76804_30327)


