

Description
Smart Money Suite Pro — Ensemble complet d'outils d'action des prix institutionnels pour cTrader
Si vous tradez en utilisant les concepts de smart money ou toute méthodologie d'action des prix basée sur le flux d'ordres institutionnel, vous connaissez la difficulté : une douzaine d'indicateurs dispersés sur votre graphique, chacun faisant partiellement le travail, aucun ne communiquant avec les autres. Smart Money Suite Pro a été conçu pour résoudre cela entièrement.
C'est un indicateur unique et autonome qui couvre chaque concept majeur de l'action des prix institutionnelle et de la méthodologie smart money — conçu de A à Z pour cTrader, optimisé pour fonctionner proprement sur des graphiques en direct sans scintillement, et rempli de fonctionnalités améliorant la qualité de vie qui le rendent réellement utilisable lors de sessions de trading réelles.
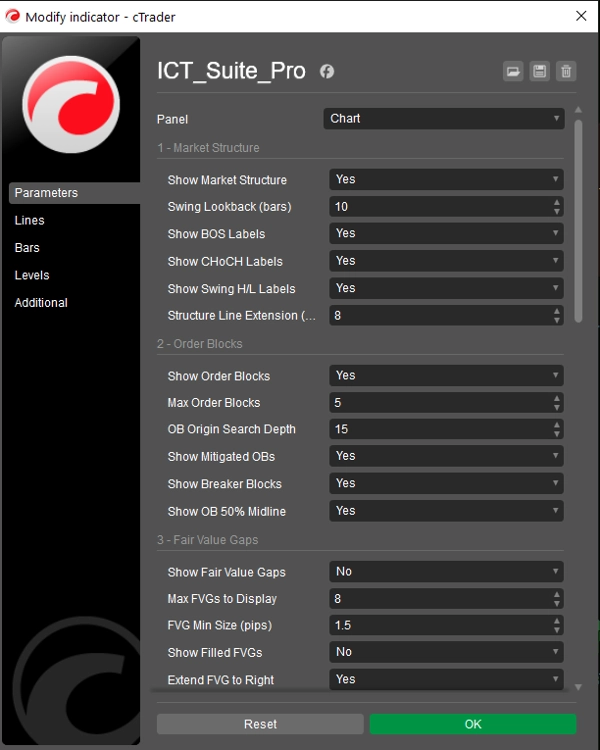
Structure du Marché — Automatique et Précise
L'indicateur analyse continuellement votre graphique à la recherche de sommets et creux confirmés, classifiant chacun comme Plus Haut Plus Haut, Plus Bas Plus Haut, Plus Haut Plus Bas, ou Plus Bas Plus Bas. Chaque Rupture de Structure (BOS) et Changement de Caractère (CHoCH) est détecté et étiqueté avec une ligne de niveau en pointillés pour que vous puissiez voir exactement où le prix a cassé la structure précédente. La distinction entre BOS (continuation de tendance) et CHoCH (renversement de tendance) est codée par couleur pour une lecture instantanée d'un coup d'œil. La profondeur de retour en arrière des oscillations est entièrement ajustable.
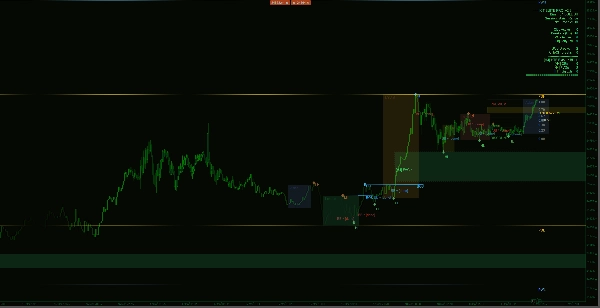
Blocs d'Ordres — Avec Suivi Complet du Cycle de Vie
Les blocs d'ordres sont identifiés en localisant la dernière bougie opposée avant chaque mouvement impulsif ayant conduit à une oscillation confirmée. Chaque bloc est dessiné sous forme de boîte colorée s'étendant vers la droite du graphique pour que vous puissiez voir d'un coup d'œil si le prix est revenu dans la zone. Lorsqu'un bloc d'ordre est atténué, le rectangle est supprimé et remplacé par un marqueur textuel discret — gardant votre graphique propre tout en conservant un enregistrement du niveau. Lorsque le prix viole ensuite l'autre côté d'un bloc d'ordre atténué, il est reclassifié en Bloc Briseur et recoloré, signalant une zone de retournement potentielle. Une ligne médiane à 50 % est tracée à l'intérieur de chaque bloc actif pour mettre en évidence la division prime/remise au sein même de la zone.
Gaps de Juste Valeur — Suivis Jusqu'à Remplissage
Les déséquilibres de prix sur trois bougies sont détectés dans les deux directions sur toute votre fenêtre de retour en arrière. Chaque gap est filtré par une taille minimale configurable en pips pour éliminer le bruit. Les gaps non remplis s'étendent vers la droite du graphique jusqu'à ce que le prix revienne les fermer, moment auquel ils sont soit supprimés soit marqués comme remplis selon vos réglages. Les déséquilibres haussiers et baissiers sont gérés simultanément.
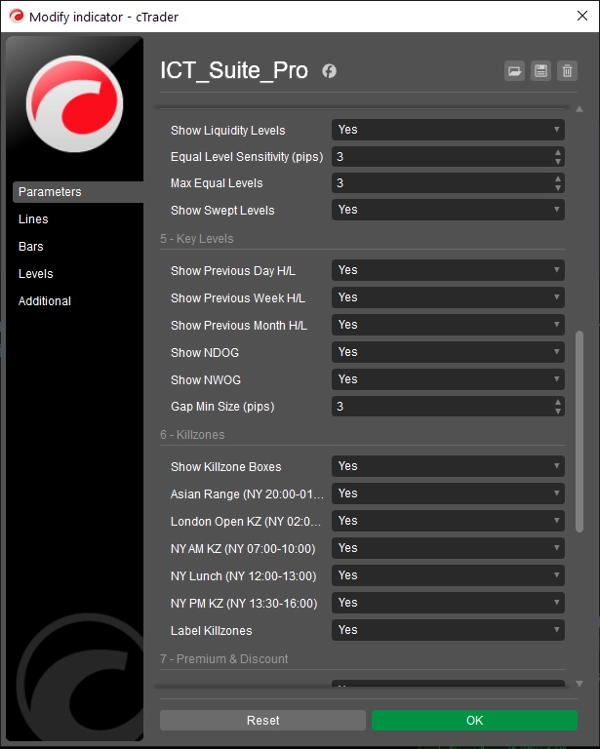
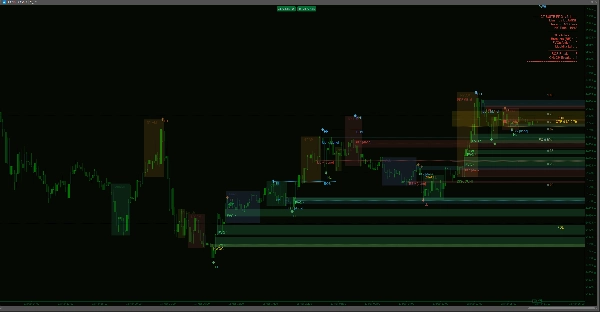
Niveaux de Liquidité — Sommets Égaux et Creux Égaux
L'indicateur recherche des grappes de sommets ou creux d'oscillation qui se situent dans une tolérance configurable en pips les uns des autres — identifiant les pools de liquidité côté achat et côté vente que le flux d'ordres institutionnel tend à cibler. Chaque niveau est dessiné avec des marques de coche aux deux points d'oscillation et une ligne en pointillés projetée vers la droite. Une fois que le prix balaye un niveau de liquidité, celui-ci est soit caché soit marqué comme balayé selon votre préférence.
Niveaux Clés — Jour, Semaine et Mois Précédents
Le plus haut/bas du jour précédent, le plus haut/bas de la semaine précédente, et le plus haut/bas du mois précédent sont automatiquement calculés à partir des données de prix de votre graphique. Toutes les limites de date sont dérivées des horodatages des barres du courtier — pas de l'horloge système locale — afin de rester précises quel que soit votre fuseau horaire ou le roulement de l'instrument. Chaque paire de niveaux utilise une couleur et un style de ligne distincts pour se superposer proprement sur le graphique.
Gaps d'Ouverture — Quotidiens et Hebdomadaires
L'indicateur analyse chaque ouverture quotidienne et hebdomadaire à la recherche d'un gap de prix entre la clôture de la session précédente et l'ouverture de la session en cours. Tout gap dépassant la taille minimale en pips définie est dessiné sous forme de rectangle coloré. Les gaps d'ouverture du nouveau jour et de la nouvelle semaine sont distingués par des couleurs différentes, vous donnant une lecture instantanée des gaps non comblés.
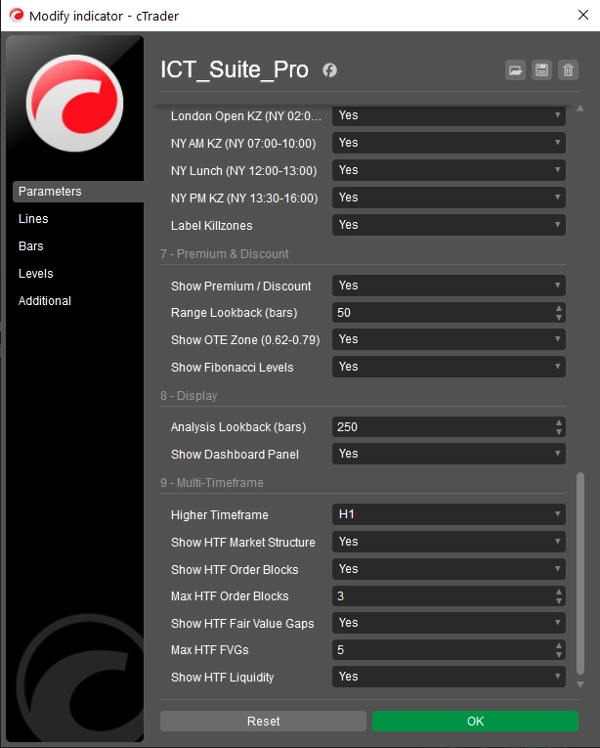
Killzones de Session — Avec Boîtes de Plage Réelles
Les fenêtres de session Asiatique, Ouverture de Londres, New York AM, New York Lunch, et New York PM sont dessinées sous forme de boîtes remplies couvrant la plage réelle du plus haut au plus bas formée durant chaque période. Les horaires sont basés sur l'heure de New York et s'ajustent automatiquement pour l'heure d'été EDT/EST. Chaque boîte peut être activée ou désactivée individuellement et étiquetée. Parce que les boîtes reflètent la plage de prix réelle plutôt que des lignes verticales fixes, vous pouvez immédiatement voir l'activité de chaque session et où le prix a trouvé ses extrêmes.
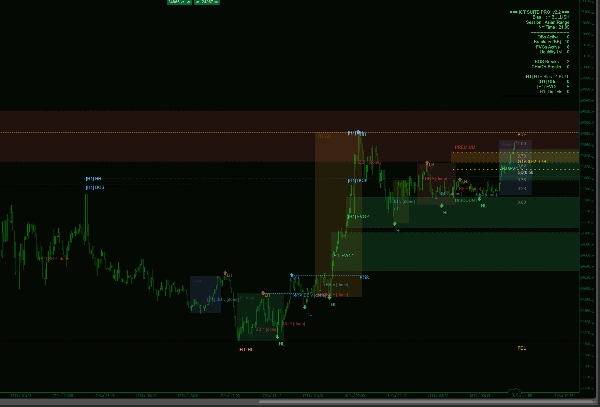
Zones Premium & Discount — Avec Plage d'Entrée Optimale
Une analyse de plage glissante calcule le plus haut et le plus bas sur une période configurable. À partir de cette plage, l'indicateur trace l'Équilibre (0,50), une zone d'entrée optimale (Fibonacci 0,62–0,79), et l'ensemble complet des niveaux clés de retracement Fibonacci. Les étiquettes Premium et Discount sont placées à l'intérieur de la plage pour que vous sachiez toujours dans quelle moitié de la plage de négociation actuelle le prix évolue. La période de retour en arrière est automatiquement ajustée pour correspondre à la fenêtre visible de barres afin qu'aucun niveau ne fasse référence à des barres invisibles.
Superposition Multi-Timeframe — La Fonctionnalité Phare
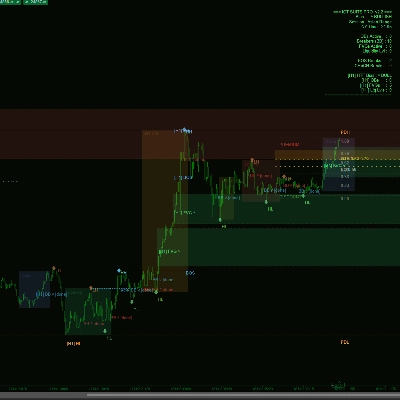
Le système MTF reconstruit les bougies de timeframe supérieur en agrégeant les barres du graphique actuel dans des créneaux temporels alignés — aucune souscription de données séparée requise. Sélectionnez votre timeframe supérieur dans le menu déroulant (M5, M15, M30, H1, H4, D1) et Smart Money Suite Pro calculera et dessinera les Blocs d'Ordres, Gaps de Juste Valeur, Structure du Marché et Niveaux de Liquidité du timeframe supérieur directement sur votre graphique actuel. Les éléments du timeframe supérieur sont visuellement distincts : bordures plus épaisses, contours en pointillés, et étiquettes préfixées par le tag du timeframe (par exemple [H4] OB ^) pour que vous sachiez toujours à quel timeframe appartient un niveau.
Si vous sélectionnez un timeframe supérieur qui est égal ou inférieur à celui de votre graphique actuel — une configuration impossible — l'indicateur affiche un avertissement clair à l'écran et ne dessine rien, évitant toute donnée trompeuse.
Le panneau de contrôle se met à jour avec une section dédiée au timeframe supérieur lorsque la superposition est active, affichant le biais HTF, le nombre de blocs d'ordre actifs, le nombre de gaps de juste valeur, et le nombre de niveaux de liquidité aux côtés du résumé du timeframe actuel.
Tableau de Bord en Direct
Un panneau propre ancré à droite affiche : le biais actuel du marché, la session de trading active, l'heure de New York, les comptes de tous les blocs d'ordre actifs, blocs briseurs, gaps de juste valeur, et niveaux de liquidité, ainsi que le nombre total de ruptures BOS et CHoCH détectées dans la fenêtre de retour en arrière. Lorsque la superposition multi-timeframe est activée, le résumé du timeframe supérieur est ajouté automatiquement en dessous.
Conçu pour le Trading en Direct
L'indicateur se redessine uniquement lorsqu'une nouvelle barre se forme — pas à chaque tick entrant — éliminant le scintillement du graphique qui affecte de nombreux indicateurs tout-en-un. Toute l'analyse s'exécute dans une fenêtre de retour en arrière configurable afin que la performance reste constante même sur des timeframes inférieurs avec un grand nombre de barres.


