
Description
TeoriaCutrim est un indicateur superposé statistique conçu pour quantifier le comportement récent du marché à travers la distribution des chandeliers et l'analyse de la volatilité. Au lieu de prédire la direction, il fournit des données objectives sur ce que le marché vient de faire dans une fenêtre configurable de chandeliers.
Données du marché analysées
L'indicateur évalue un nombre défini par l'utilisateur de chandeliers récents (période de retour en arrière) et extrait :
- Nombre et pourcentage de chandeliers haussiers (fermeture > ouverture)
- Nombre et pourcentage de chandeliers baissiers (fermeture < ouverture)
- Différence entre la dominance haussière et baissière
- Plage moyenne des chandeliers (en pips)
- Plage du chandelier actuel (en pips)
- Plage totale des prix sur la fenêtre analysée
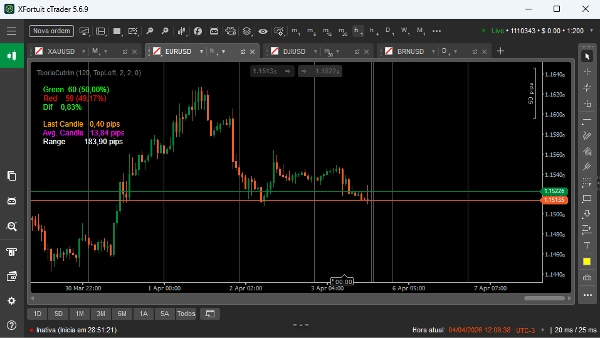
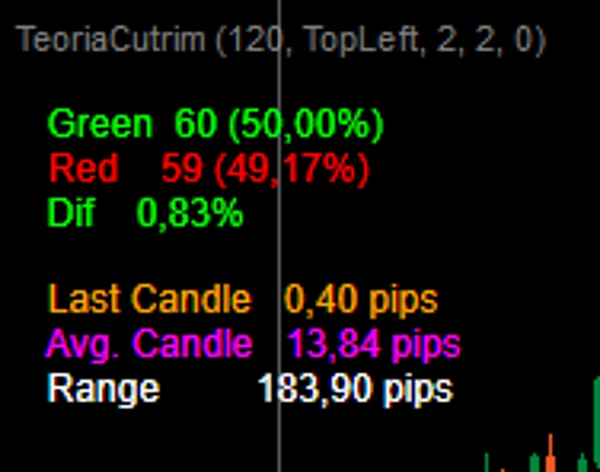
Affichage visuel et interprétation
L'indicateur affiche les métriques clés directement sur le graphique :
- Vert : total des chandeliers haussiers et pourcentage
- Rouge : total des chandeliers baissiers et pourcentage
- Dif : différence absolue entre les pourcentages haussiers et baissiers
- Dernier chandelier : taille actuelle du chandelier en pips
- Chandelier moyen : taille moyenne des chandeliers dans la fenêtre sélectionnée
- Plage : distance entre le plus haut et le plus bas dans la fenêtre
L'interprétation est simple :
- Un nombre plus élevé de chandeliers haussiers suggère une pression récente à la hausse
- Un nombre plus élevé de chandeliers baissiers suggère une pression récente à la baisse
- Une faible différence (Dif) indique un équilibre ou un hasard
- Une augmentation de la taille moyenne des chandeliers indique une volatilité croissante
- Une grande plage totale suggère une expansion du marché, tandis qu'une petite plage suggère une compression
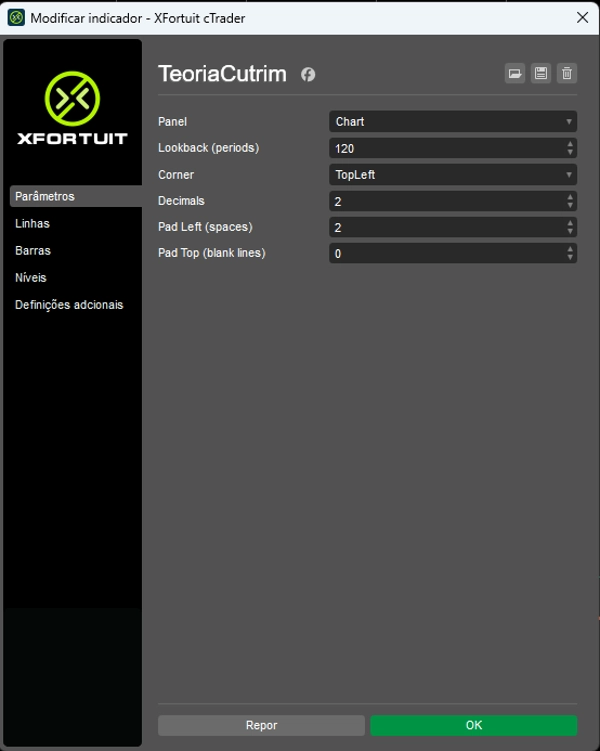
Paramètres clés
- Lookback : nombre de chandeliers utilisés pour l'analyse (entièrement ajustable)
- Corner : position à l'écran de l'affichage des données
- Décimales : nombre de décimales affichées
- Pad Left / Pad Top : ajustements d'espacement visuel
Cas d'utilisation
TeoriaCutrim est mieux utilisé comme outil de contexte, pas comme générateur de signaux. Les applications typiques incluent :
- Mesurer le déséquilibre statistique avant d'entrer en position
- Identifier l'expansion ou la contraction de la volatilité
- Filtrer les transactions en fonction du comportement récent des chandeliers
- Soutenir des stratégies quantitatives ou basées sur la probabilité
Utilisateur cible
Cet indicateur est conçu pour les traders qui s'appuient sur les données, les statistiques et l'analyse objective plutôt que sur la reconnaissance subjective de motifs. Convient aux traders discrétionnaires comme systématiques.


![Logo de "Tabajara corrigido[fix]"](https://cdn.ctrader.com/image/webp/7f4bbef8-b245-4ebd-80d7-582fffc0c90c_28378)


