Description
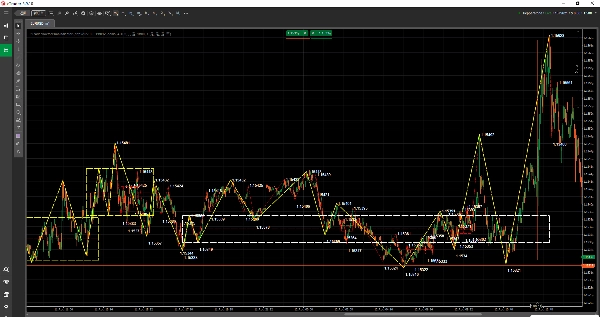
L'indicateur Dr Chan Theory pour cTrader est un indicateur d'analyse technique de structure de marché / superposition de graphique utilisé pour afficher les structures de la théorie Dr Chan sur les graphiques cTrader.
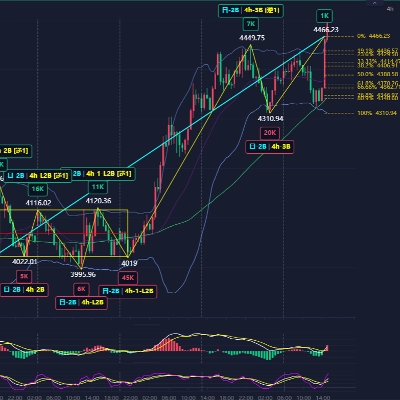
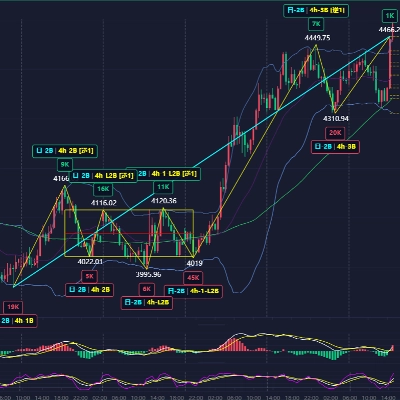
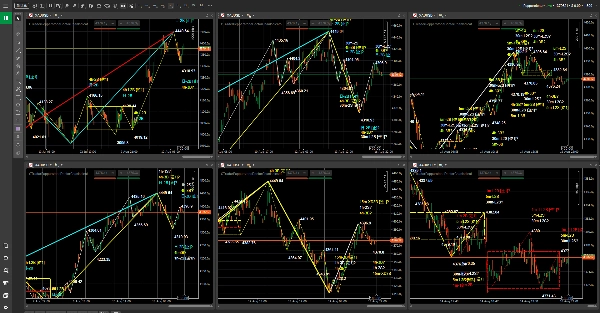
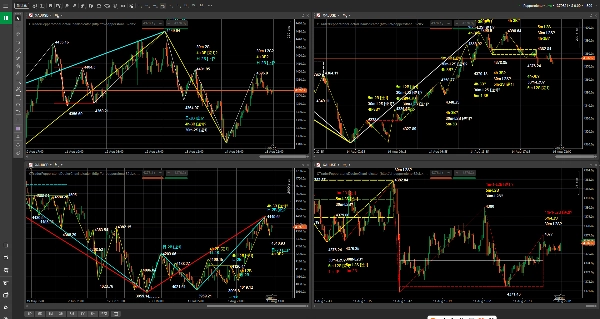
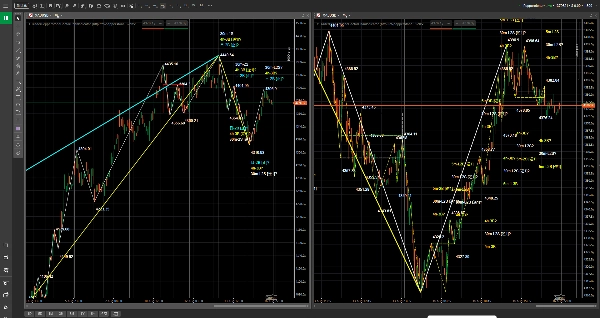
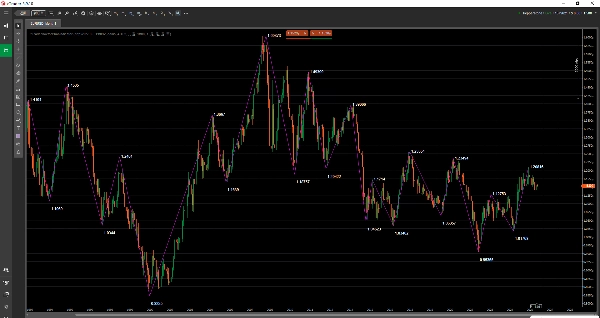
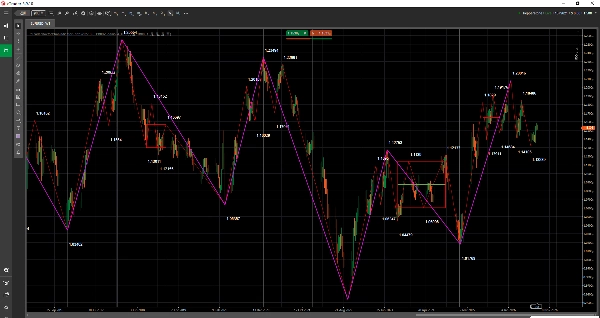
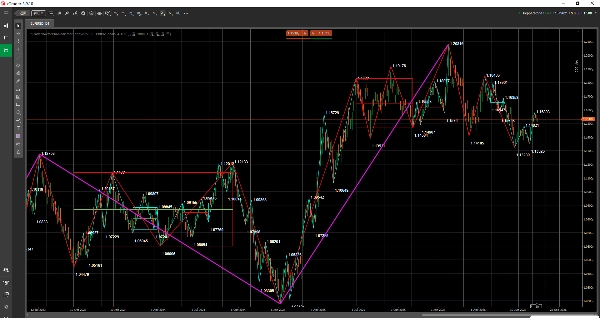
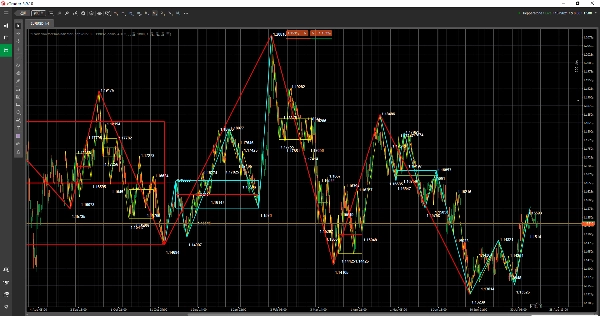
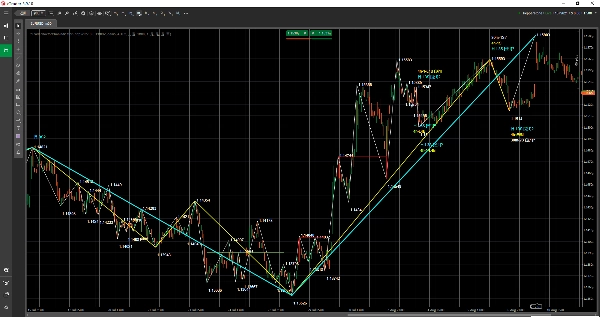
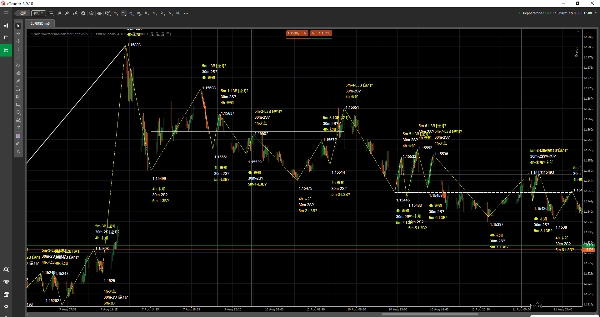
Il convient aux traders qui se concentrent sur l'action des prix, la structure de la tendance et l'analyse multi-échelle temporelle. L'indicateur affiche les principales structures de la théorie Dr Chan sous forme d'objets graphiques, y compris les structures Bi, les zones Zhongshu, les marqueurs d'achat/vente et plus encore, aidant les utilisateurs à observer le rythme du marché, les changements structurels et les relations entre différentes échelles temporelles de manière plus intuitive.
Cet indicateur n'est pas un robot de trading automatisé et n'est pas un service de signal de trading. Son but est d'aider les utilisateurs à lire les graphiques, à examiner les marchés et à élaborer des plans de trading plus clairement.
La version actuelle est compatible avec les symboles et les échelles temporelles spécifiés de Pepperstone cTrader. Ce produit est un indicateur tiers indépendant et n'est pas un produit officiel de Pepperstone ni un produit partenaire de Pepperstone.
Présentation de l'indicateur
- Type d'indicateur : indicateur de structure de marché / superposition de graphique.
- Instruments préférés : symboles Forex, indices, matières premières, cryptomonnaies et CFD actions spécifiés dans Pepperstone cTrader.
- Échelles temporelles préférées : 1 minute, 5 minutes, 15 minutes, 30 minutes, 1 heure, 4 heures, quotidien, hebdomadaire et mensuel.
- Cas d'utilisation en trading : observation de la structure du graphique, analyse multi-échelle temporelle, préparation et support de révision du plan de trading.
Ce que vous pouvez voir sur le graphique
- Structures Bi : utilisées pour observer le rythme des oscillations et la progression structurelle.
- Zones Zhongshu : utilisées pour observer les zones importantes de consolidation, d'équilibre et de chevauchement structurel.
- Marqueurs d'achat/vente : utilisés pour aider à localiser les points de référence structurels clés.
- Étiquettes de texte, lignes horizontales, lignes verticales, zones rectangulaires, lignes de tendance et autres objets graphiques.
- La correspondance automatique des données avec l'échelle temporelle actuelle du graphique est prise en charge par défaut, facilitant l'observation multi-échelle temporelle.
À qui s'adresse cet indicateur
- Utilisateurs qui apprennent ou utilisent la théorie Dr Chan et l'analyse de structure de la théorie Chan.
- Utilisateurs qui souhaitent voir les informations de structure directement sur les graphiques cTrader.
- Utilisateurs qui utilisent Pepperstone pour consulter le Forex, les indices, les matières premières, les cryptomonnaies ou les CFD actions.
- Traders qui ont besoin de comparer les structures de tendance à travers différentes échelles temporelles.
- Utilisateurs qui souhaitent rendre les flux de travail de lecture de graphique, de planification et de révision plus clairs.
Accès et licence
L'accès au produit et la gestion des licences se font via le processus d'achat, d'essai et d'installation du cTrader Store. Veuillez vous référer au statut d'achat, au statut d'essai et aux informations produit affichées sur la page produit du cTrader Store.
Symboles Pepperstone actuellement pris en charge
Forex :
GBPUSD, EURUSD, USDJPY, USDCHF, AUDUSD, USDCAD, GBPJPY
Indices :
US500, NAS100, GER40, UK100, JPN225, VIX, HSTECH
Matières premières :
XAUUSD, XAGUSD
Cryptomonnaies :
BTCUSD, ETHUSD
Actions :
AAPL.US-24, MSFT.US-24, GOOG.US-24, AMZN.US-24, TSLA.US-24, NVDA.US-24, META.US-24, NFLX.US-24, JPM.US-24
Échelles temporelles prises en charge
1 minute, 5 minutes, 15 minutes, 30 minutes, 1 heure, 4 heures, quotidien, hebdomadaire et mensuel.
Flux de travail suggéré
1. Ouvrez un graphique pour un symbole pris en charge dans l'environnement Pepperstone cTrader.
2. Chargez l'indicateur Dr Chan Theory sur le graphique.
3. Le temps des données de l'indicateur Dr Chan Theory est UTC+0. Lors de la vérification des structures du graphique, assurez-vous de changer le fuseau horaire du graphique cTrader vers le fuseau horaire correspondant avant de comparer les positions.
4. Assurez-vous que l'échelle temporelle actuelle du graphique est prise en charge. L'indicateur adapte automatiquement les données à l'échelle temporelle du graphique.
5. Activez ou désactivez "Afficher Bi", "Afficher Zhongshu" et "Afficher Achat/Vente" selon les besoins.
6. Observez la structure du graphique en même temps que votre propre plan de trading, gestion des positions et contrôle des risques.
Paramètres
La version actuelle expose uniquement les 3 paramètres visibles suivants dans le panneau d'indicateur cTrader. La période des données, le suffixe du symbole du courtier, le cache, le rafraîchissement, le transfert compressé et les paramètres de journalisation sont gérés en interne par l'indicateur et ne nécessitent pas de configuration pour une utilisation normale.
Afficher Bi
Valeur par défaut : "true"
Afficher ou non les structures Bi.
Afficher Zhongshu
Valeur par défaut : "true"
Afficher ou non les zones Zhongshu.
Afficher Achat/Vente
Valeur par défaut : "true"
Afficher ou non les marqueurs d'achat/vente.
Notes importantes
- Ce produit est un indicateur assistant d'analyse technique, pas un robot de trading automatisé.
- L'indicateur ne passe pas d'ordres automatiquement.
- L'indicateur ne constitue pas un conseil en investissement, un service de signal de trading ou une garantie de profit.
- La version actuelle est compatible uniquement avec les symboles Pepperstone cTrader spécifiés et les échelles temporelles spécifiées.
- Le temps des données de l'indicateur Dr Chan Theory est UTC+0. Lors de son affichage sur un graphique cTrader, veuillez passer au fuseau horaire correspondant avant de vérifier les positions des structures.
- Les utilisateurs doivent l'utiliser conjointement avec leur propre plan de trading, gestion des positions, contrôle des risques et jugement indépendant.
Orientation des mises à jour futures
La version actuelle priorise les symboles et échelles temporelles spécifiés de Pepperstone cTrader. Les mises à jour futures pourraient continuer à étendre à plus de courtiers, plus de correspondances de symboles et un champ de service de données plus complet selon le plan produit.
Avertissement sur les risques
Le trading sur les marchés financiers comporte des risques. Les performances passées ne garantissent pas les résultats futurs. Cet indicateur est uniquement un outil d'assistance à l'analyse technique et à l'apprentissage. Il ne constitue pas un conseil en investissement, un service de signal de trading ou une garantie de profit. Les structures historiques ne représentent pas les résultats futurs. Les utilisateurs doivent le tester pleinement dans leur propre environnement de trading et l'utiliser avec précaution en respectant les règles de gestion des risques.